GEOFRAME / 3D SITE CONTEXT FROM PUBLIC DATA

Draw a boundary.
Get the real place in 3D.

GeoFrame builds a measured 3D model of any neighborhood from public data: LiDAR terrain and building heights, mapped footprints, streets, trees and water. Study massing in context, check sun and shadow, bring in your CAD model and share the result, all in a web browser.

  • USGS 3DEP LiDAR
  • OpenStreetMap
  • County parcels & zoning
  • Street-level photo survey

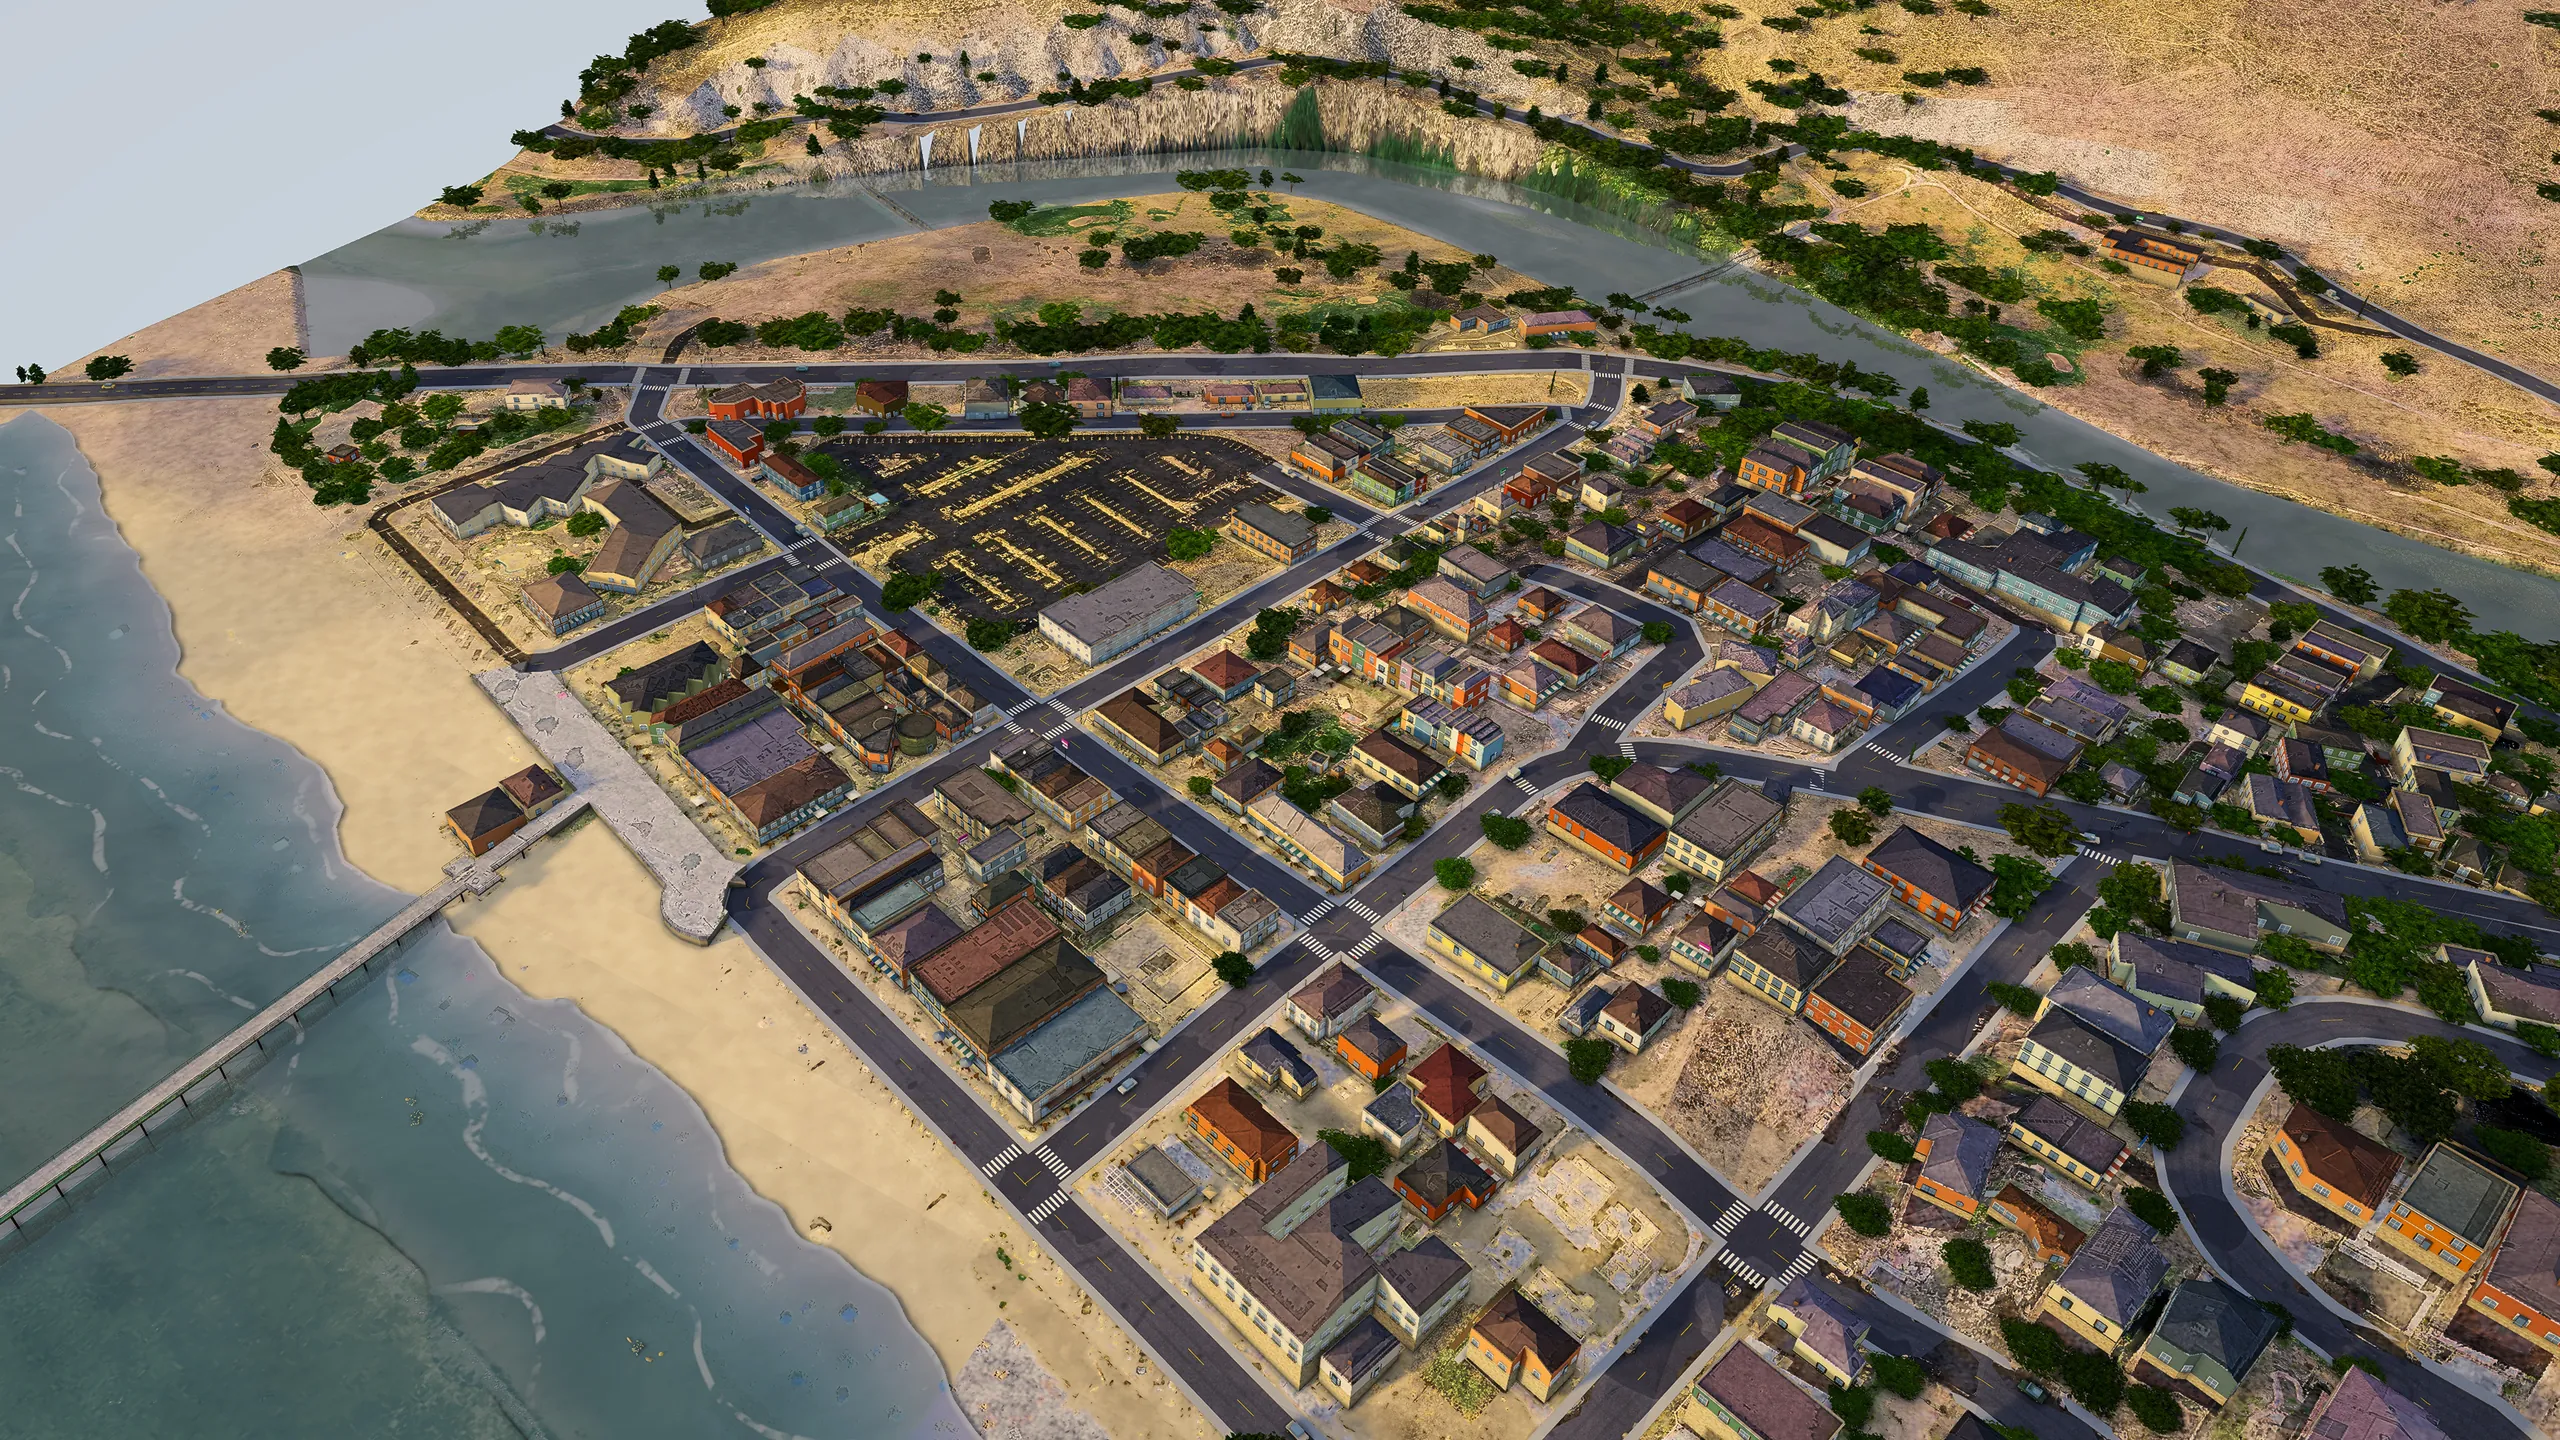
Avila Beach, San Luis Obispo County, rendered live in GeoFrame from open data. Imagery © Esri, Maxar, Earthstar Geographics · Terrain USGS 3DEP · Map data © OpenStreetMap contributors · Building footprints © Microsoft

256 km²in one request: up to 64 districts of 2 × 2 km
10CAD and 3D formats to import, from DXF and IFC to FBX
0installs: desktop browser, iPad or phone
1package to run it on your own server

HOW GEOFRAME WORKS

Pick a square of the map.
Get it back as real 3D topography.

You choose the ground; GeoFrame does the modelling. It turns the square you select into a measured 3D model of the terrain and everything standing on it, built from public data with nothing traced by hand.

  1. 01

    Pick a square

    Drag a square on the map anywhere the public data reaches, from 500 m to 2 km a side. Ask for up to 64 of them, 256 km², in one request.

  2. 02

    GeoFrame builds the topography

    USGS LiDAR becomes real terrain: hills, valleys, creeks and coastline. Buildings rise to their measured heights, with streets, trees and water laid on top.

  3. 03

    Explore and export it

    Fly over it, drop to street level, turn the sun and measure, all in the browser. Bring in your own CAD in 10 formats, and export images, video or a .glb model.

WATCH A DISTRICT GET MADE

From a square on the map to a district you can explore and edit

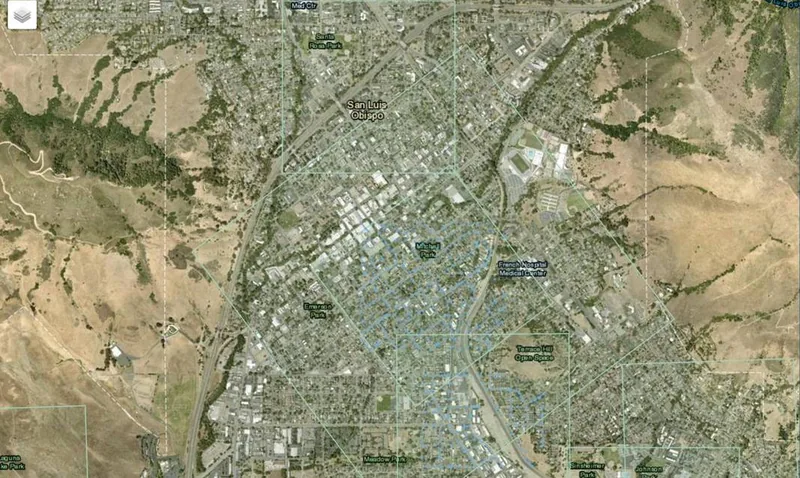
GeoFrame's district builder: a satellite map of San Luis Obispo with a square being dragged over downtown
01Select an area on the map Drag a square over any neighborhood on the satellite map. Each side snaps to whole 16 m lots, from 500 m up to 2 km.
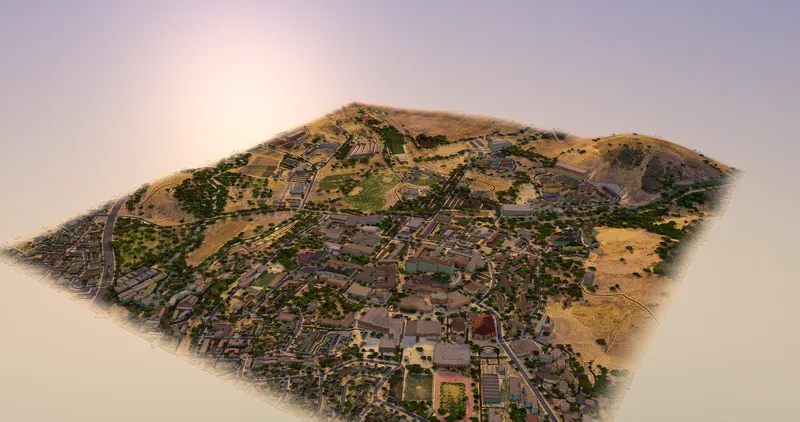
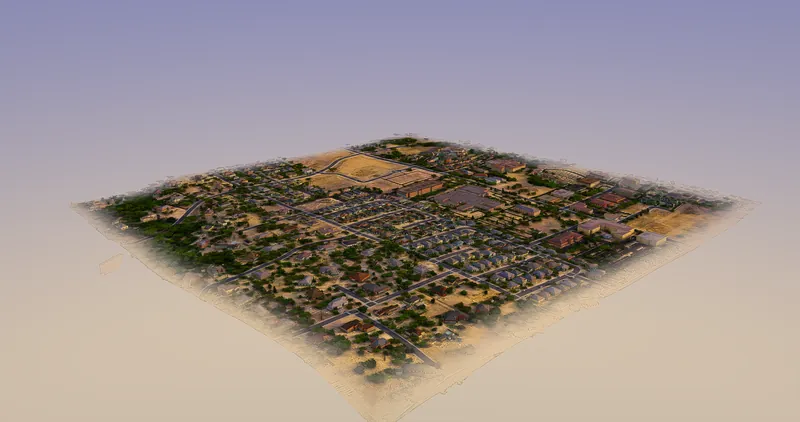
The finished Cal Poly district as a 3D tile: hills, campus buildings, streets and trees
02GeoFrame builds it in 3D Your square comes back as a 3D district: LiDAR terrain, every building at its measured height, with streets, trees and water.
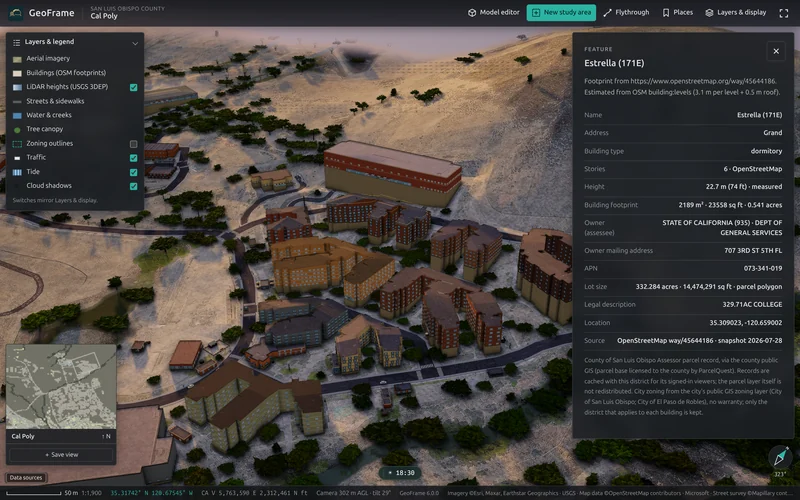
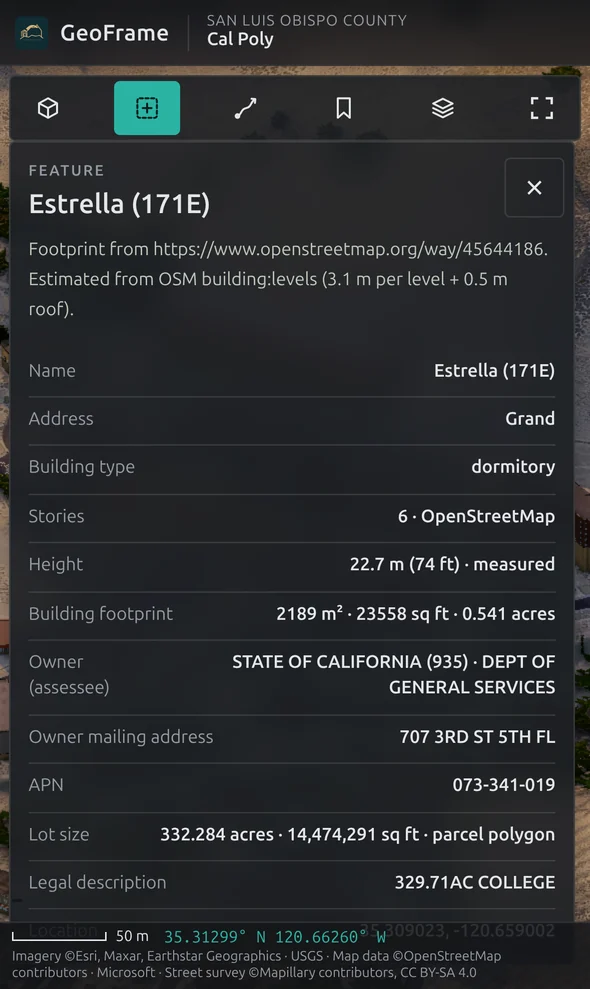
A selected dormitory in the 3D district with a panel listing its height, stories, owner, parcel number, lot size and coordinates
03Get a ton of info about it Click any building for its measured height, stories, owner, parcel number, lot size and coordinates, with layers for zoning, traffic and tide.
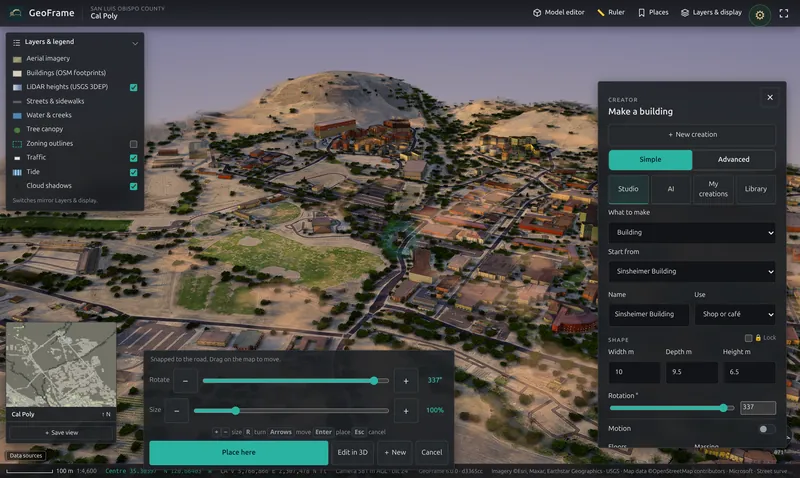
The Make a building panel open over the district, with width, depth, height and rotation controls and a Place here button
04Edit it Add or change buildings right in the district: start from one that's there, set its width, depth and height, turn it to the street and place it.

SEE IT MOVE

Not a picture of a place.
A model you can walk into.

Every GeoFrame district is live 3D: fly the coastline, drop to street level, turn the sun, measure a setback. Every image on this page is a GeoFrame view captured in the browser from districts built entirely from open data.

Five real places, Avila Beach, Harmony Valley, the Gaviota Coast, Santa Margarita and Cal Poly, modelled in 3D from open data and rendered live in the browser.
Avila Beach A rising flight from the pier over the beachfront to the village and creek.
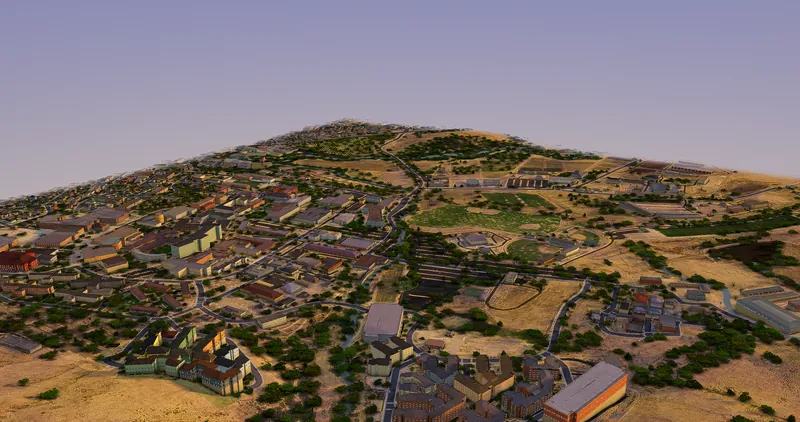
Cal Poly campus A descending approach across the campus toward the hills.
Santa Margarita A slow orbit over the town grid and the surrounding foothills.

REAL PLACES, BUILT FROM OPEN DATA

Eight places on the Central Coast.
None of them modelled by hand.

Each view is a live GeoFrame district, captured in the browser at 4K. Terrain, buildings, streets, trees and water were generated from public data; nobody traced a footprint or placed a tree. Select any image to see it full size.

Avila Beach, San Luis Obispo County, in GeoFrame: every street, parcel and building footprint placed from open geodata, with terrain-accurate hills behind.
Avila BeachSan Luis Obispo CountyEvery street, parcel and building footprint placed from open geodata, with terrain-accurate hills behind.
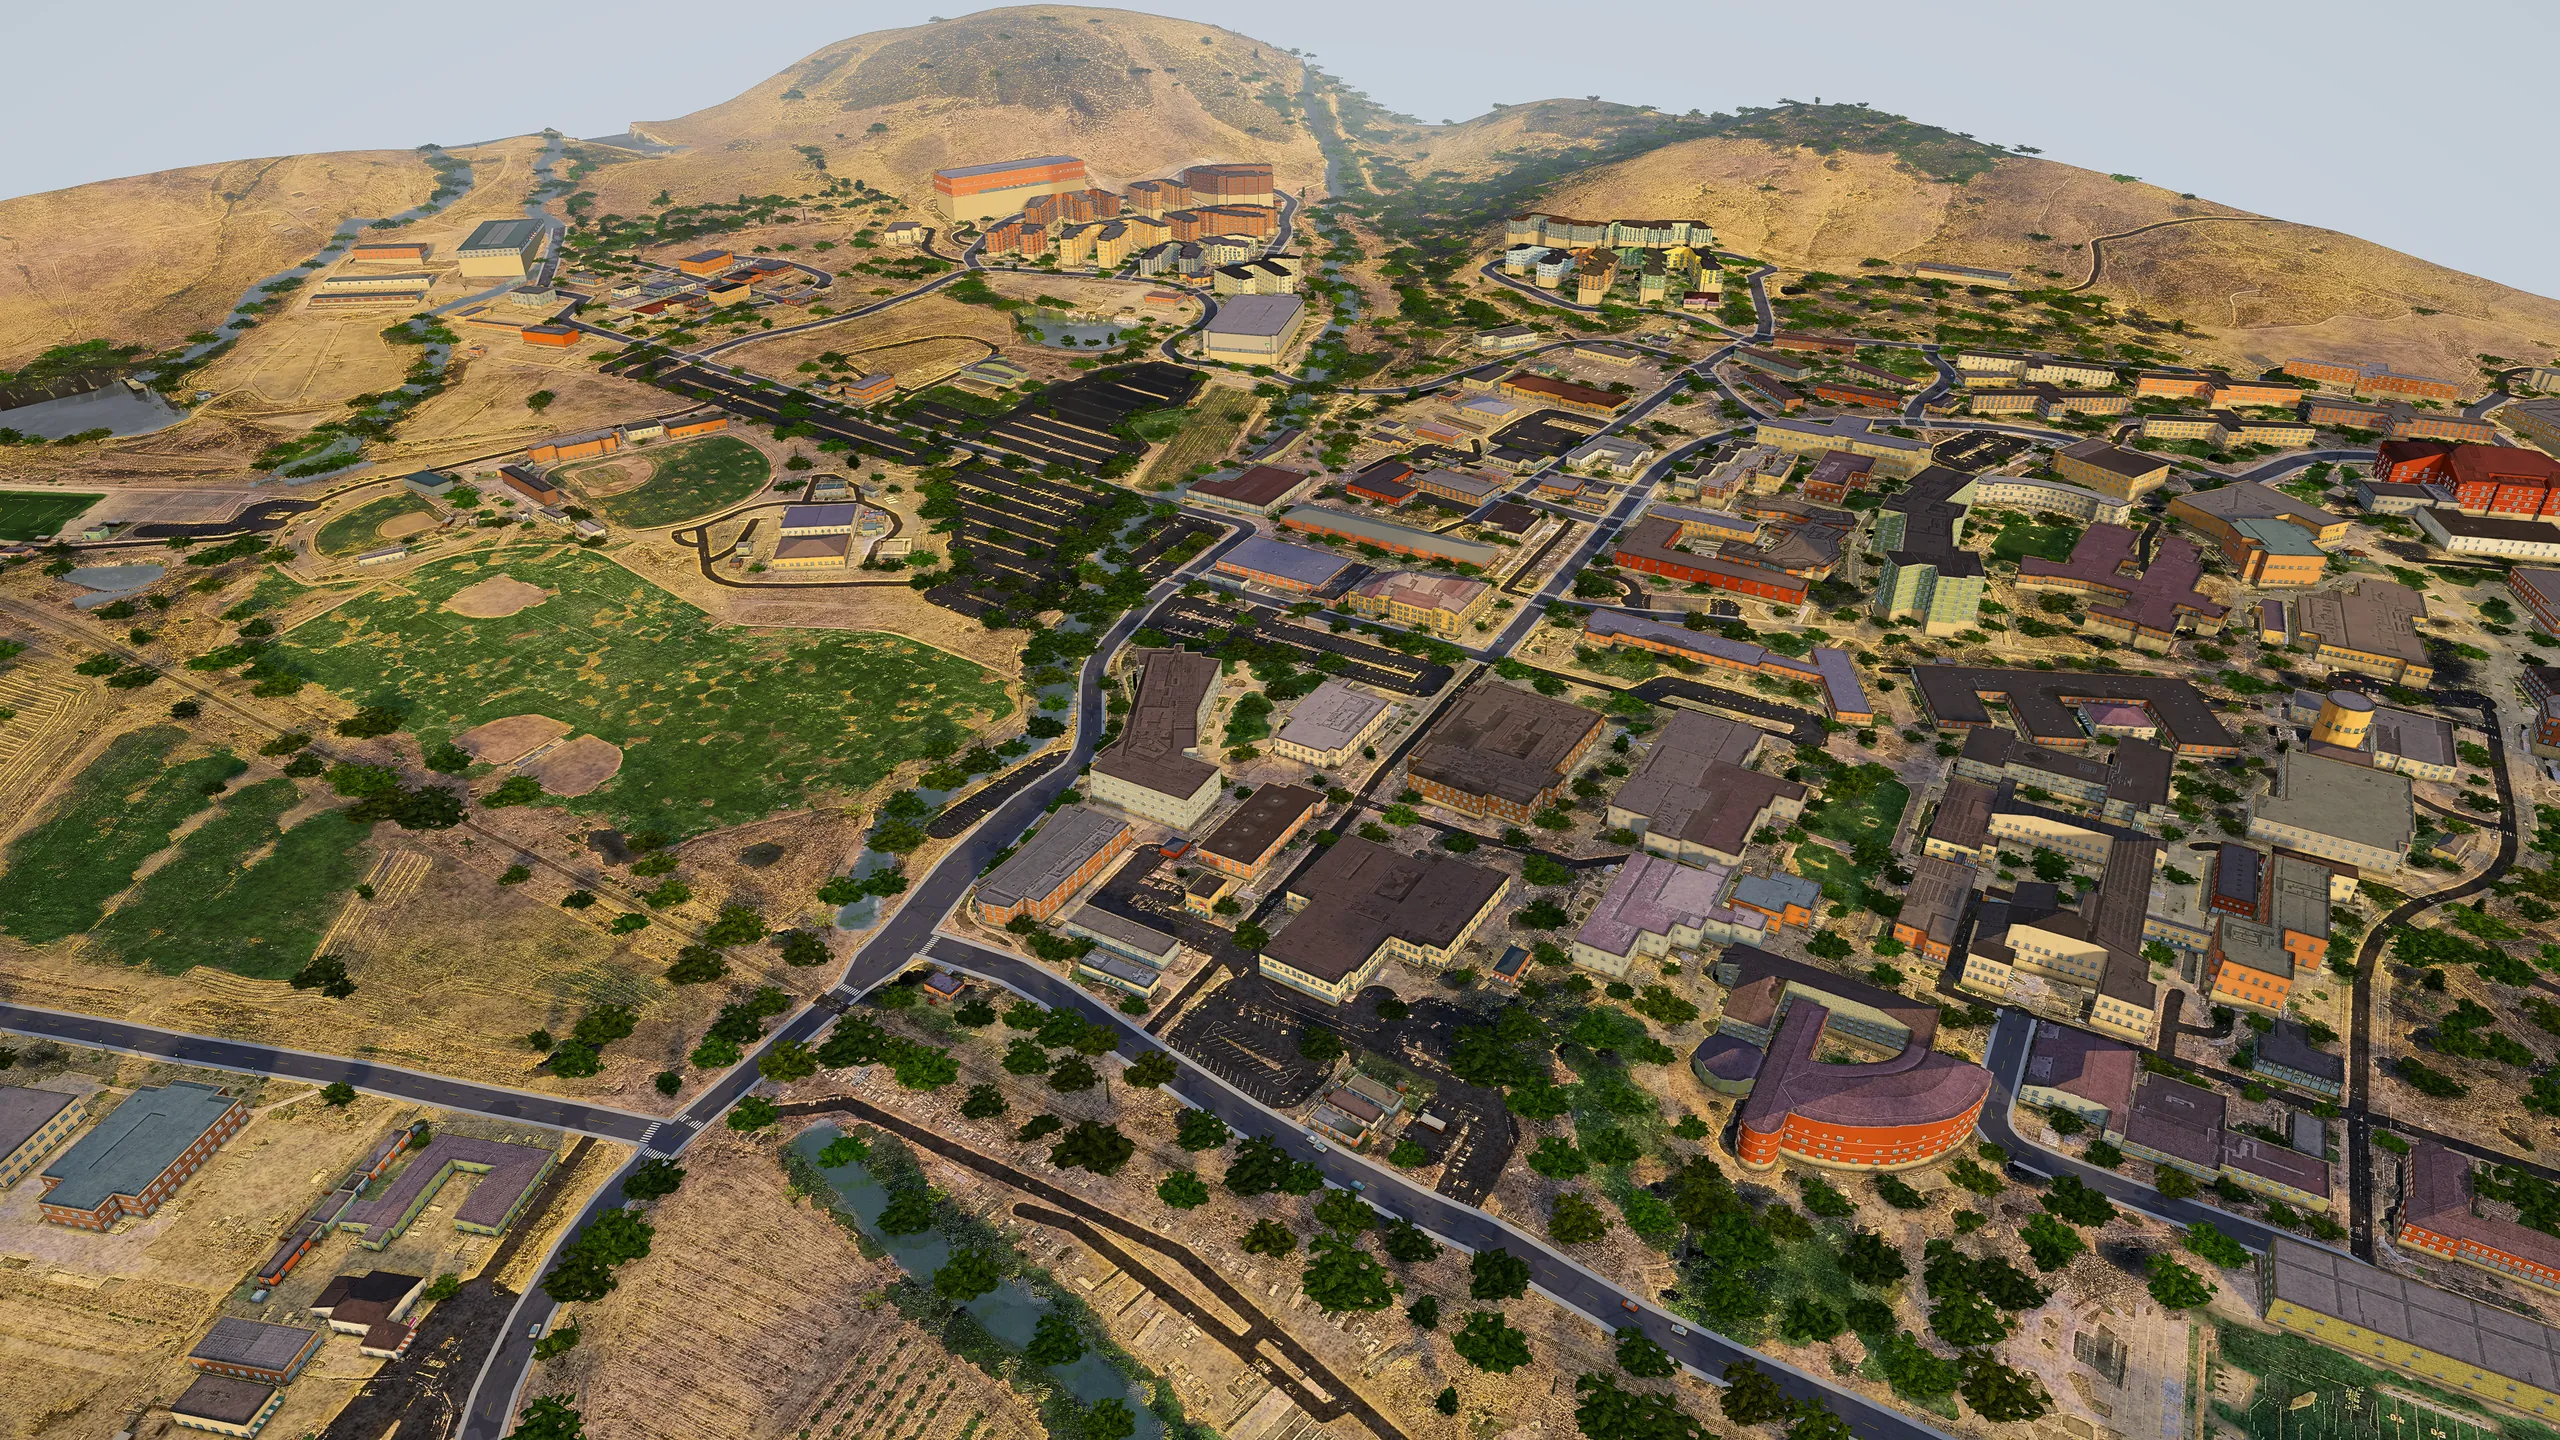
Cal Poly campus, San Luis Obispo, in GeoFrame: campus buildings, sports fields and agricultural land beneath the surrounding hills.
Cal Poly campusSan Luis ObispoCampus buildings, sports fields and agricultural land beneath the surrounding hills.
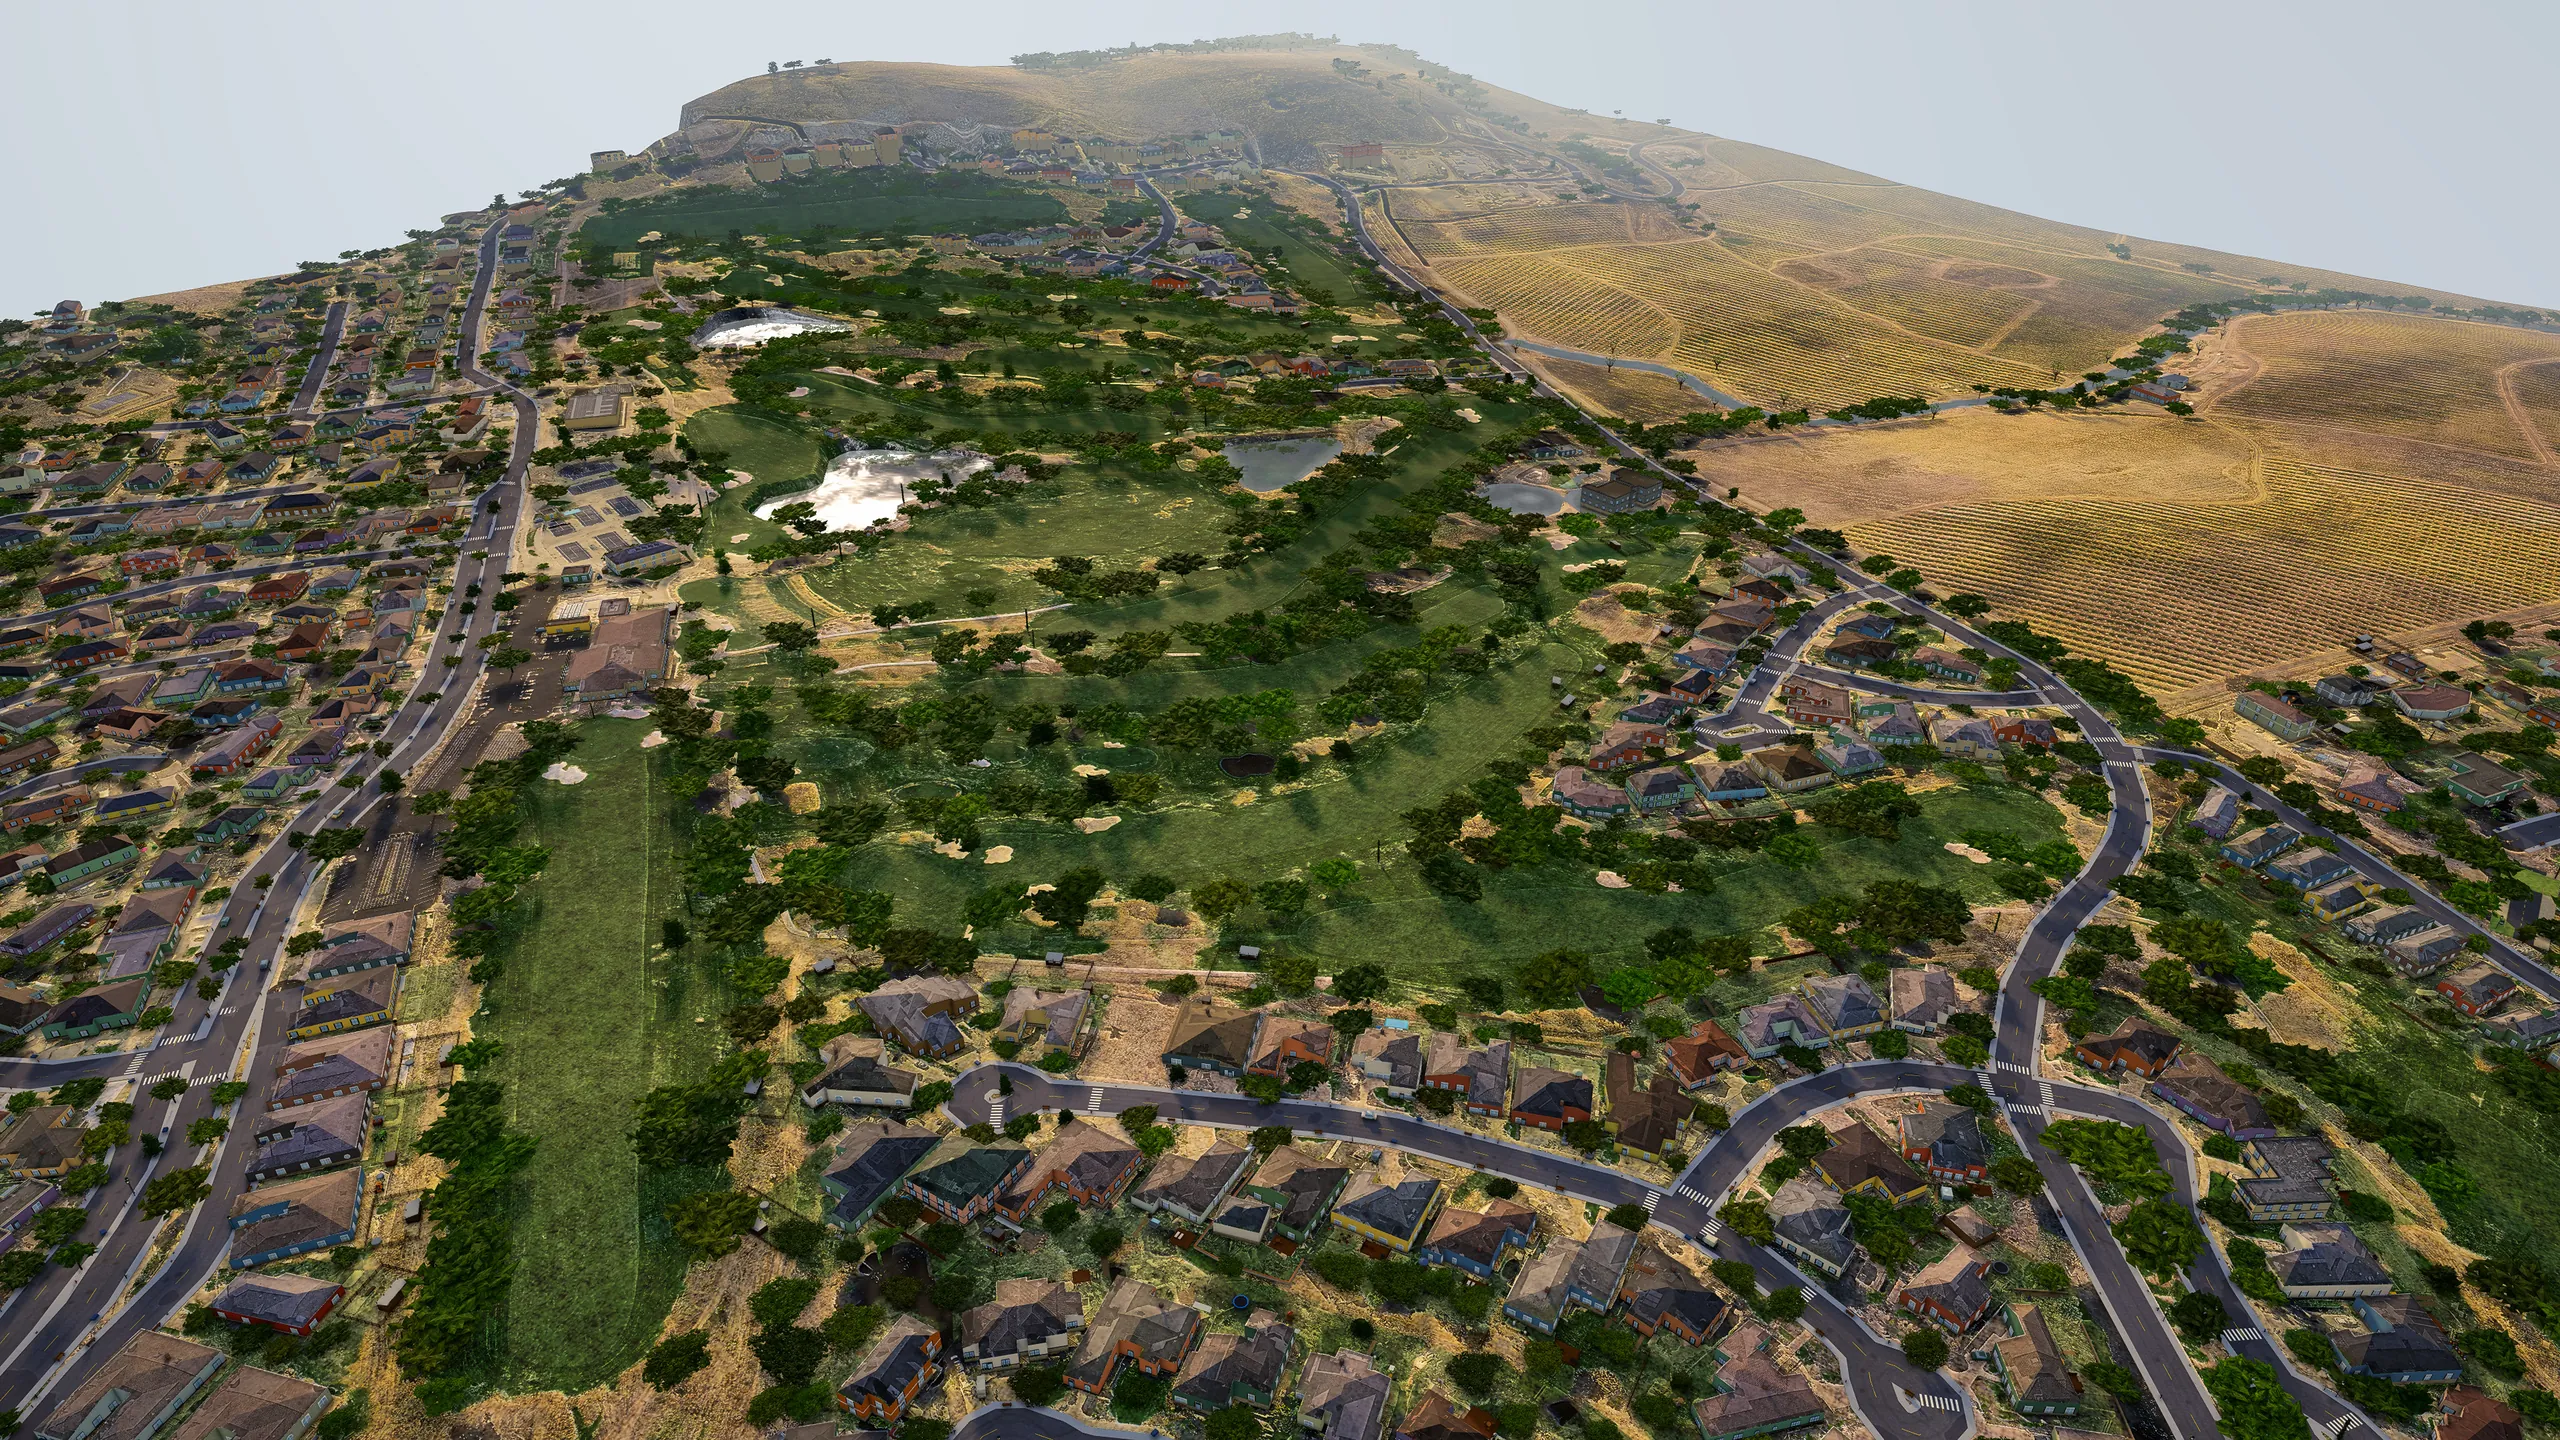
San Luis Obispo Country Club, Edna Valley, in GeoFrame: golf course, residential streets and vineyard rows on the edge of the Edna Valley.
San Luis Obispo Country ClubEdna ValleyGolf course, residential streets and vineyard rows on the edge of the Edna Valley.
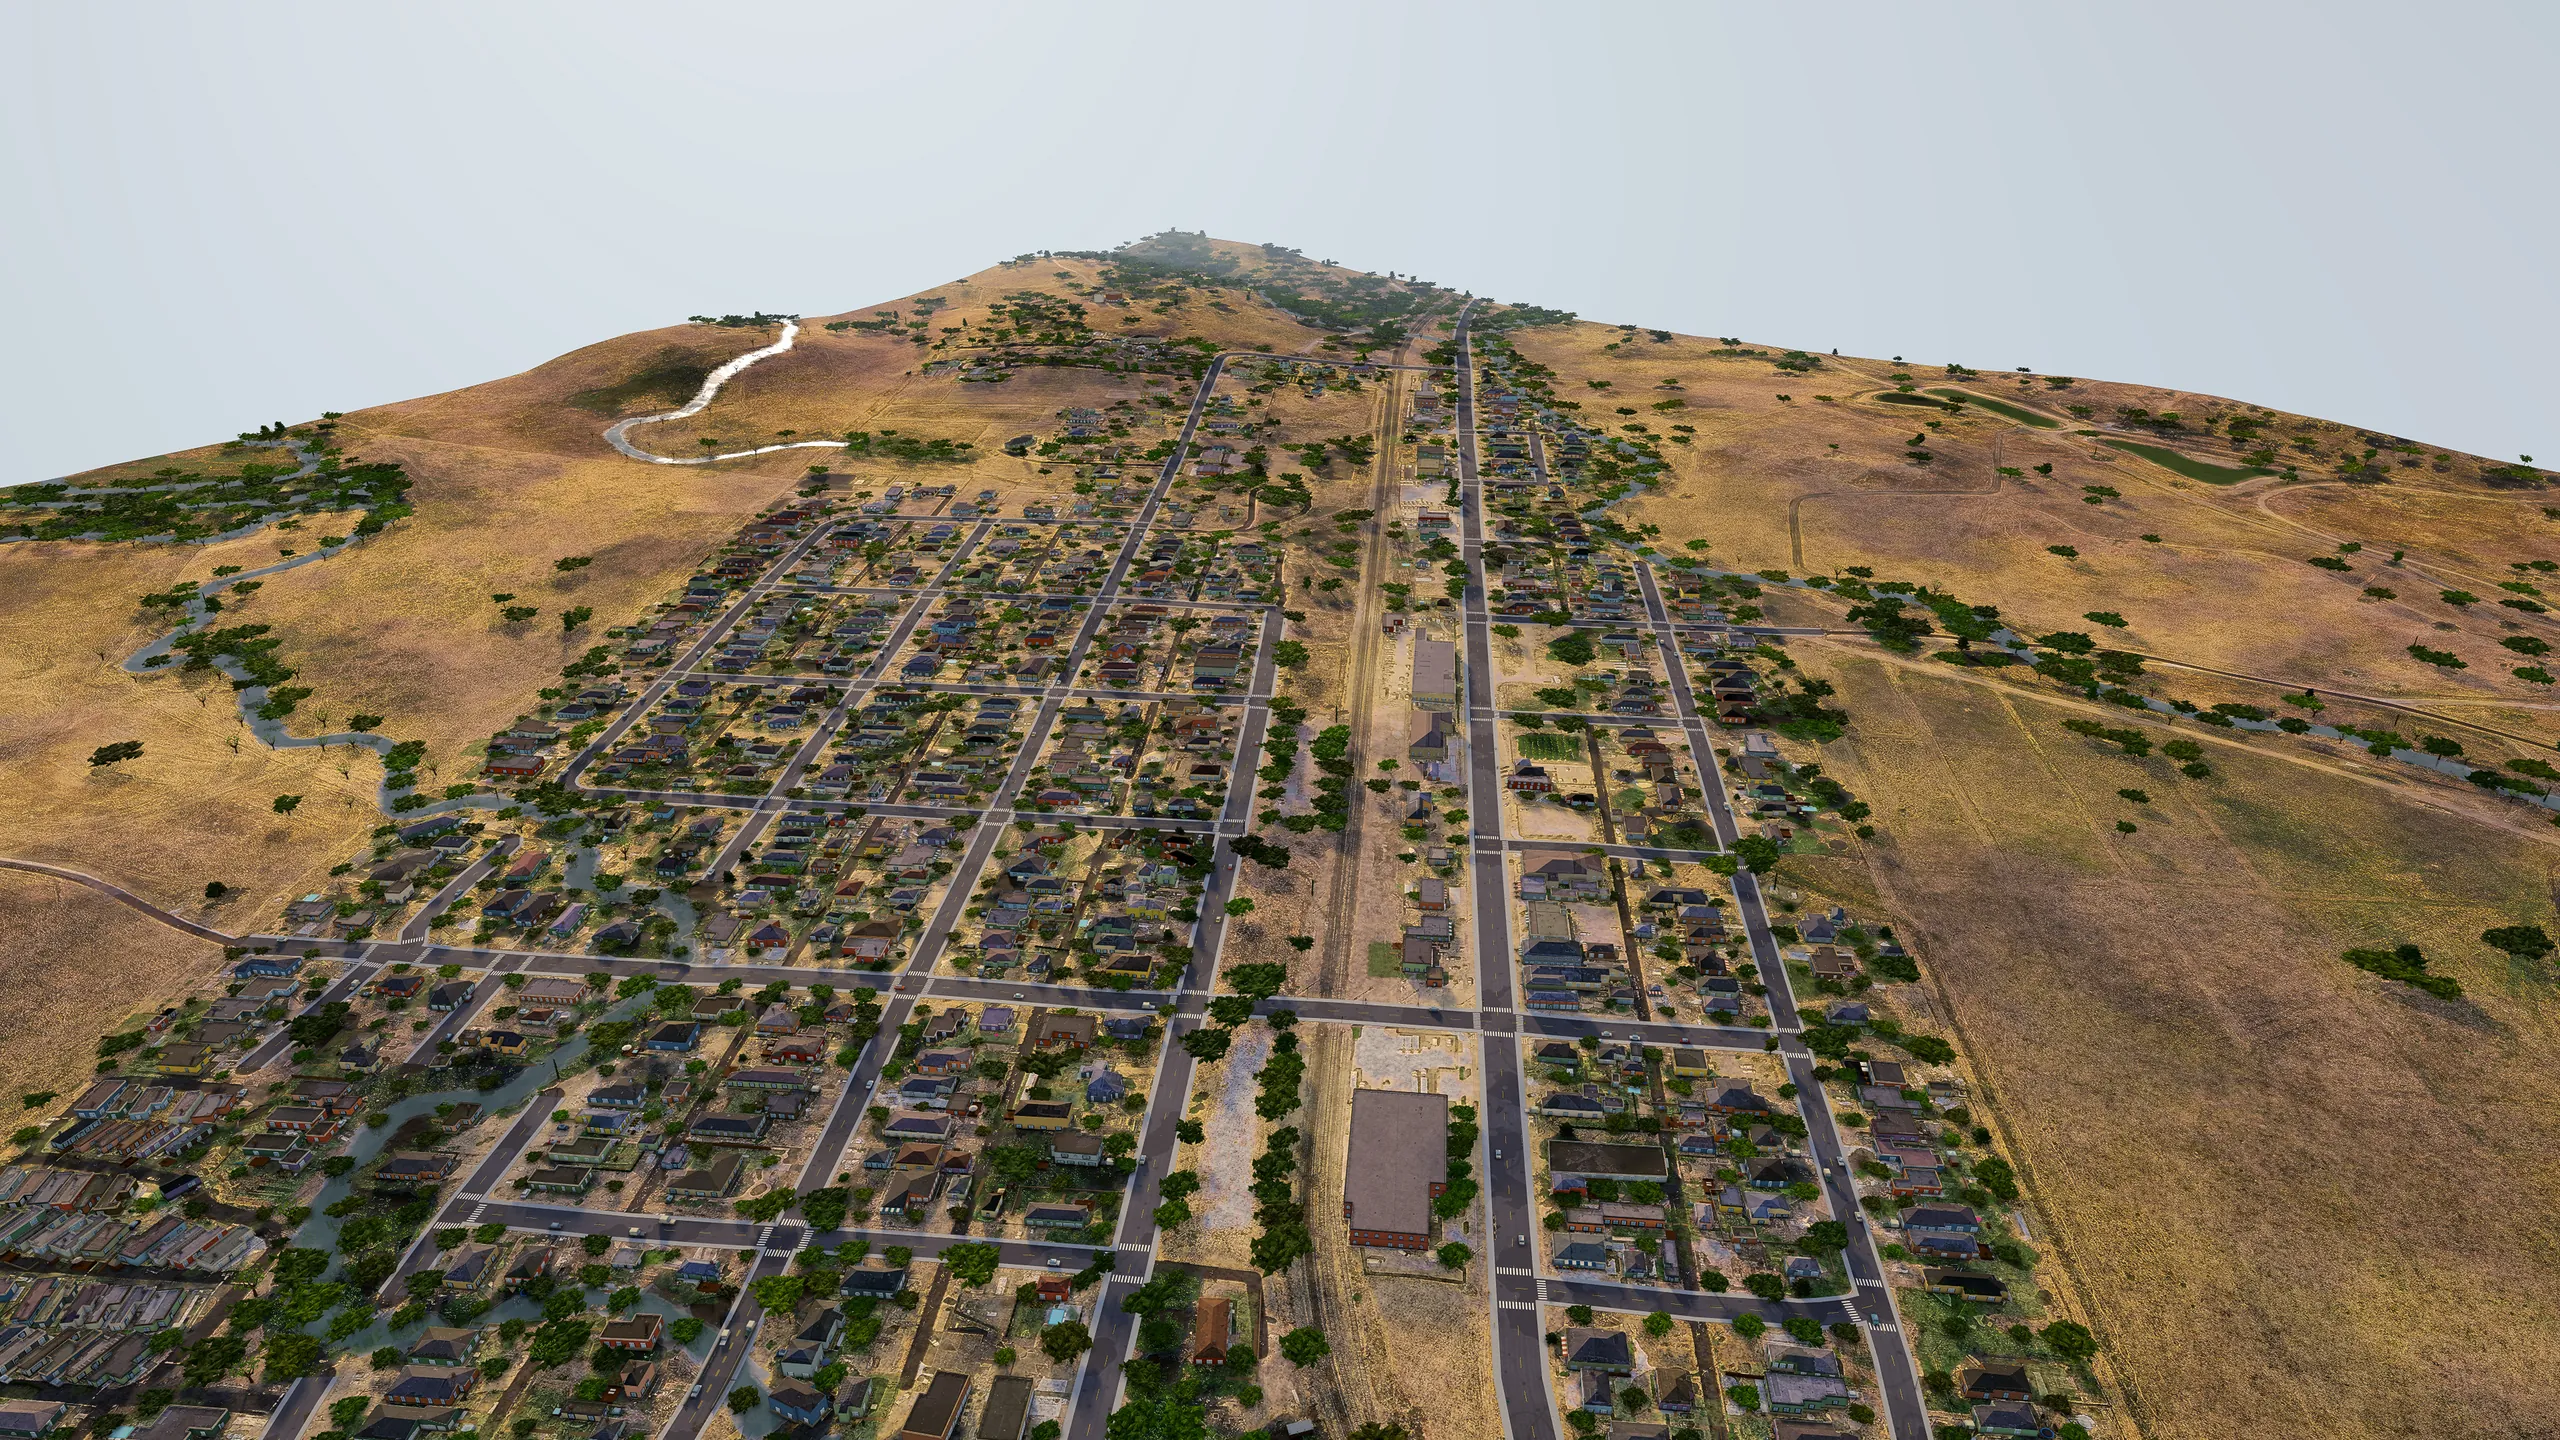
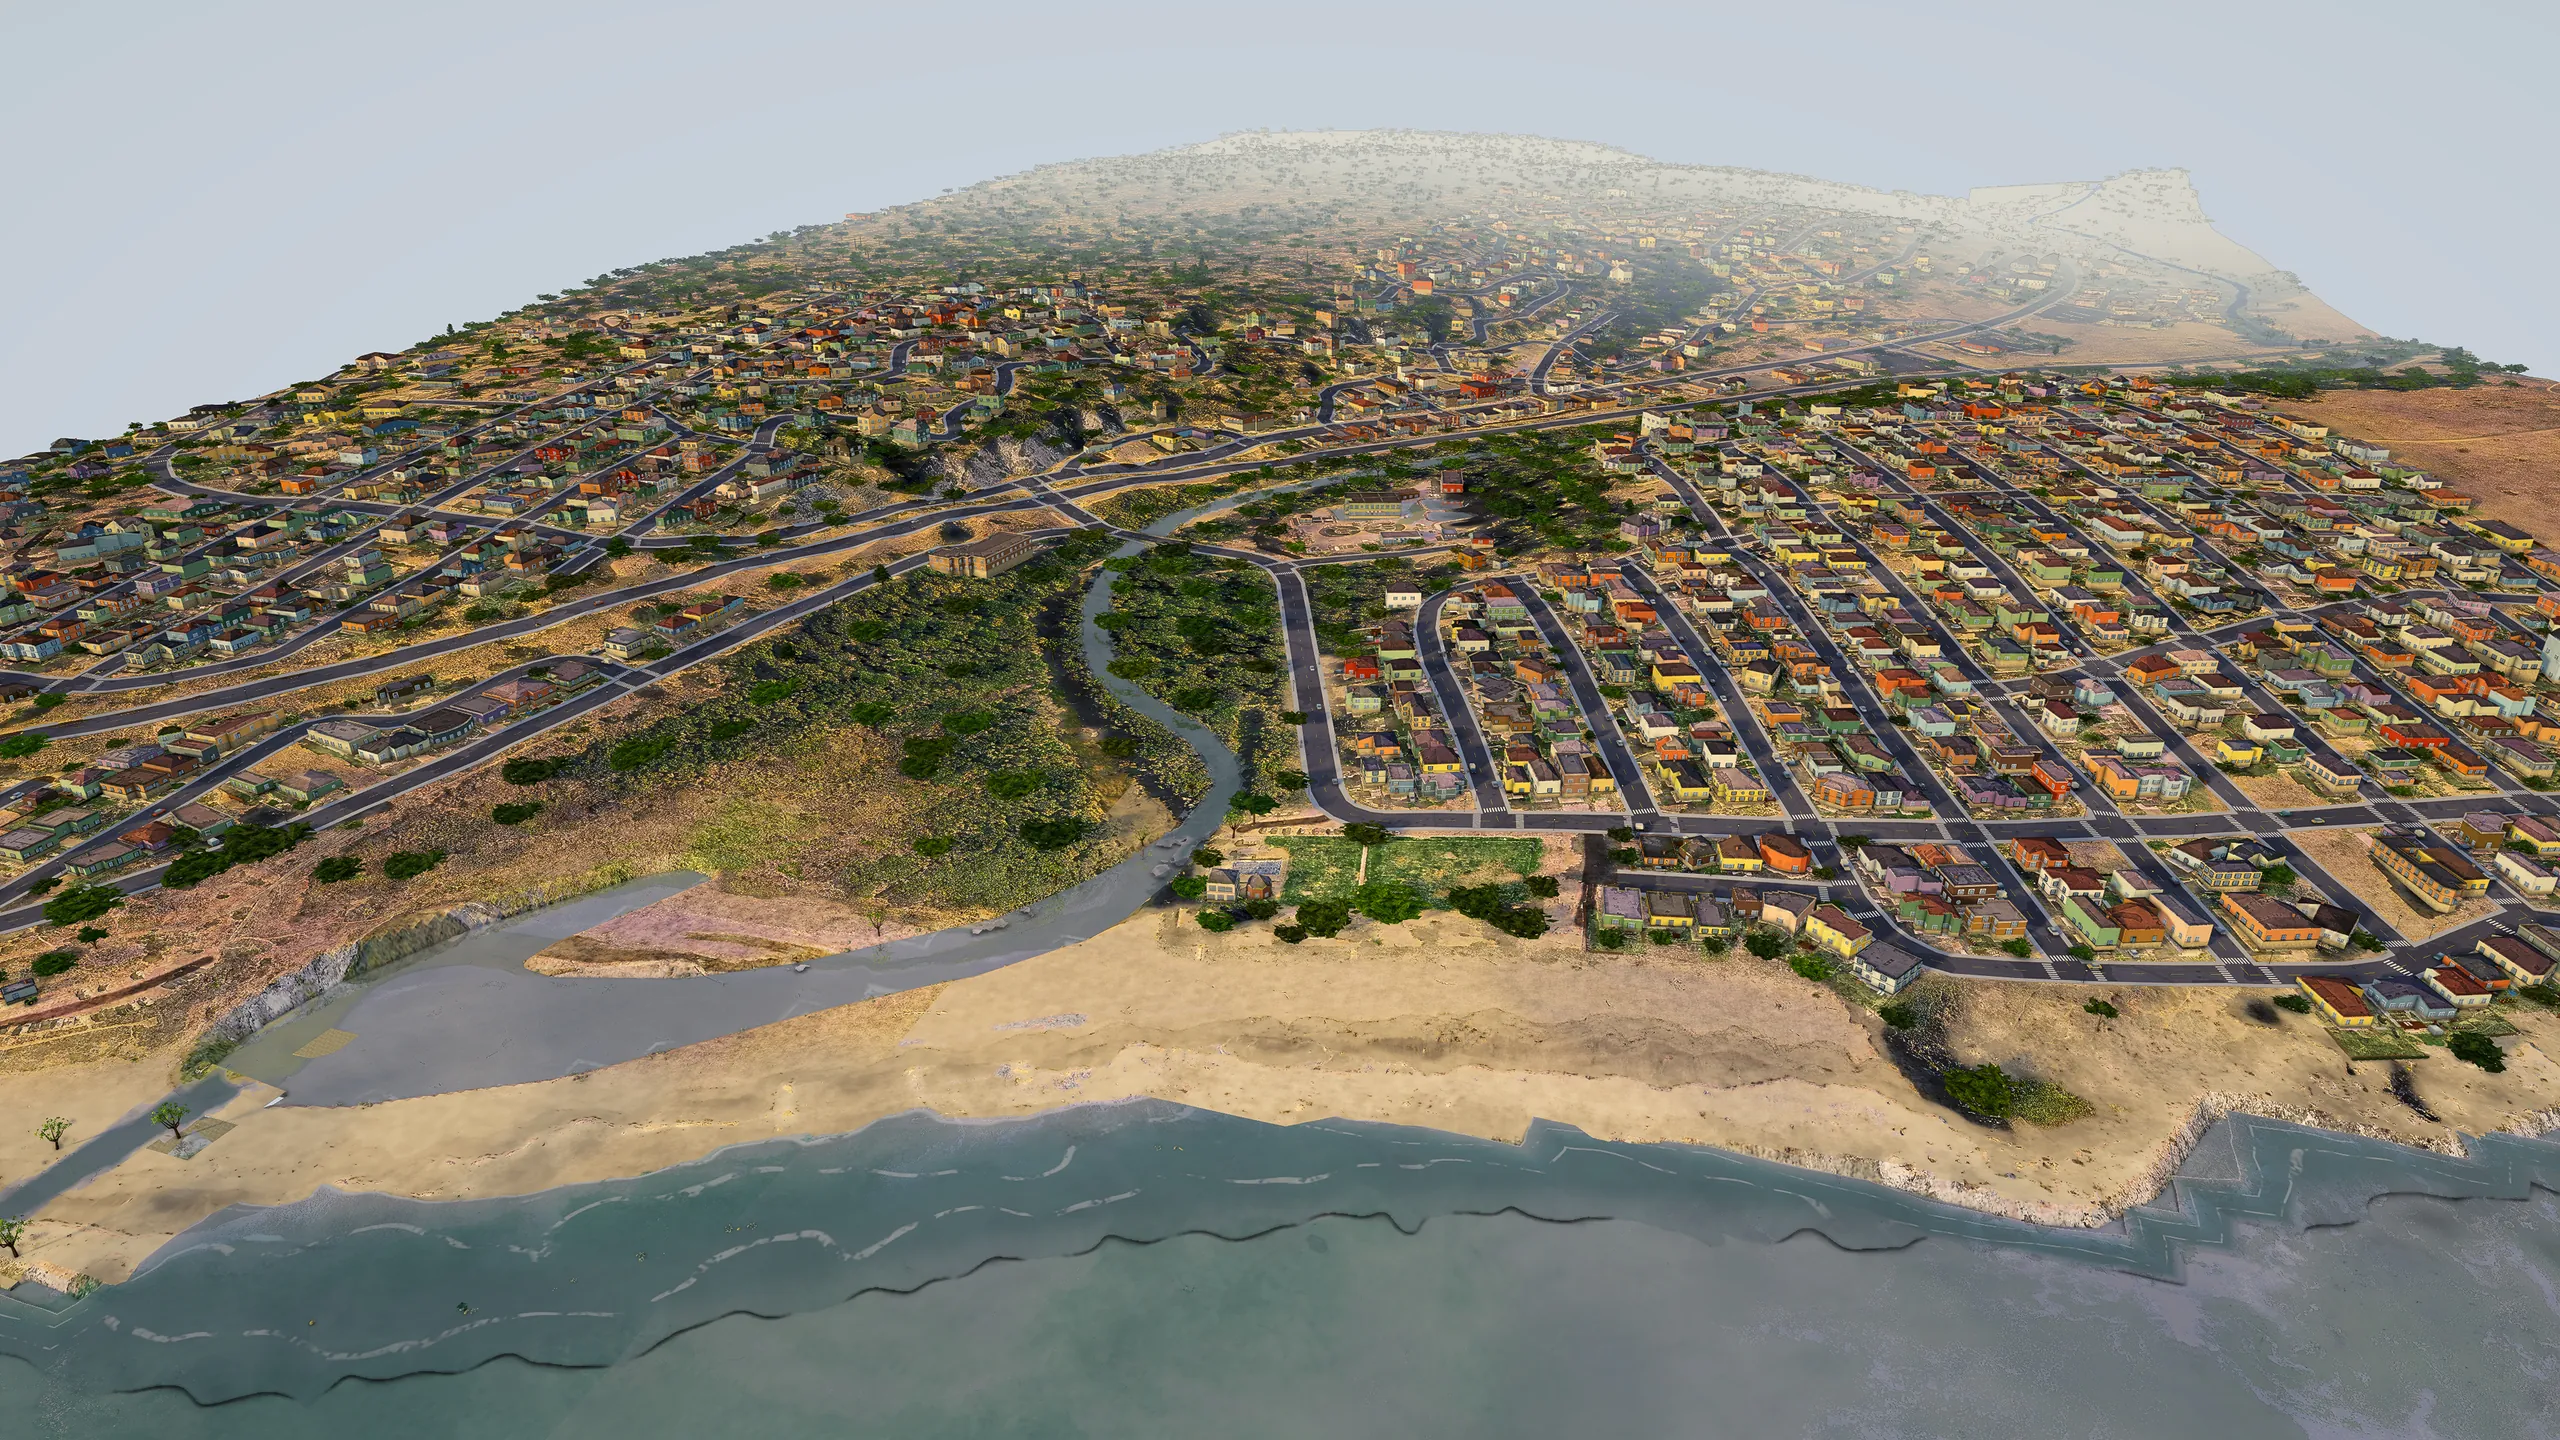
Santa Margarita, San Luis Obispo County, in GeoFrame: the full town grid running up into the golden Santa Lucia foothills.
Santa MargaritaSan Luis Obispo CountyThe full town grid running up into the golden Santa Lucia foothills.
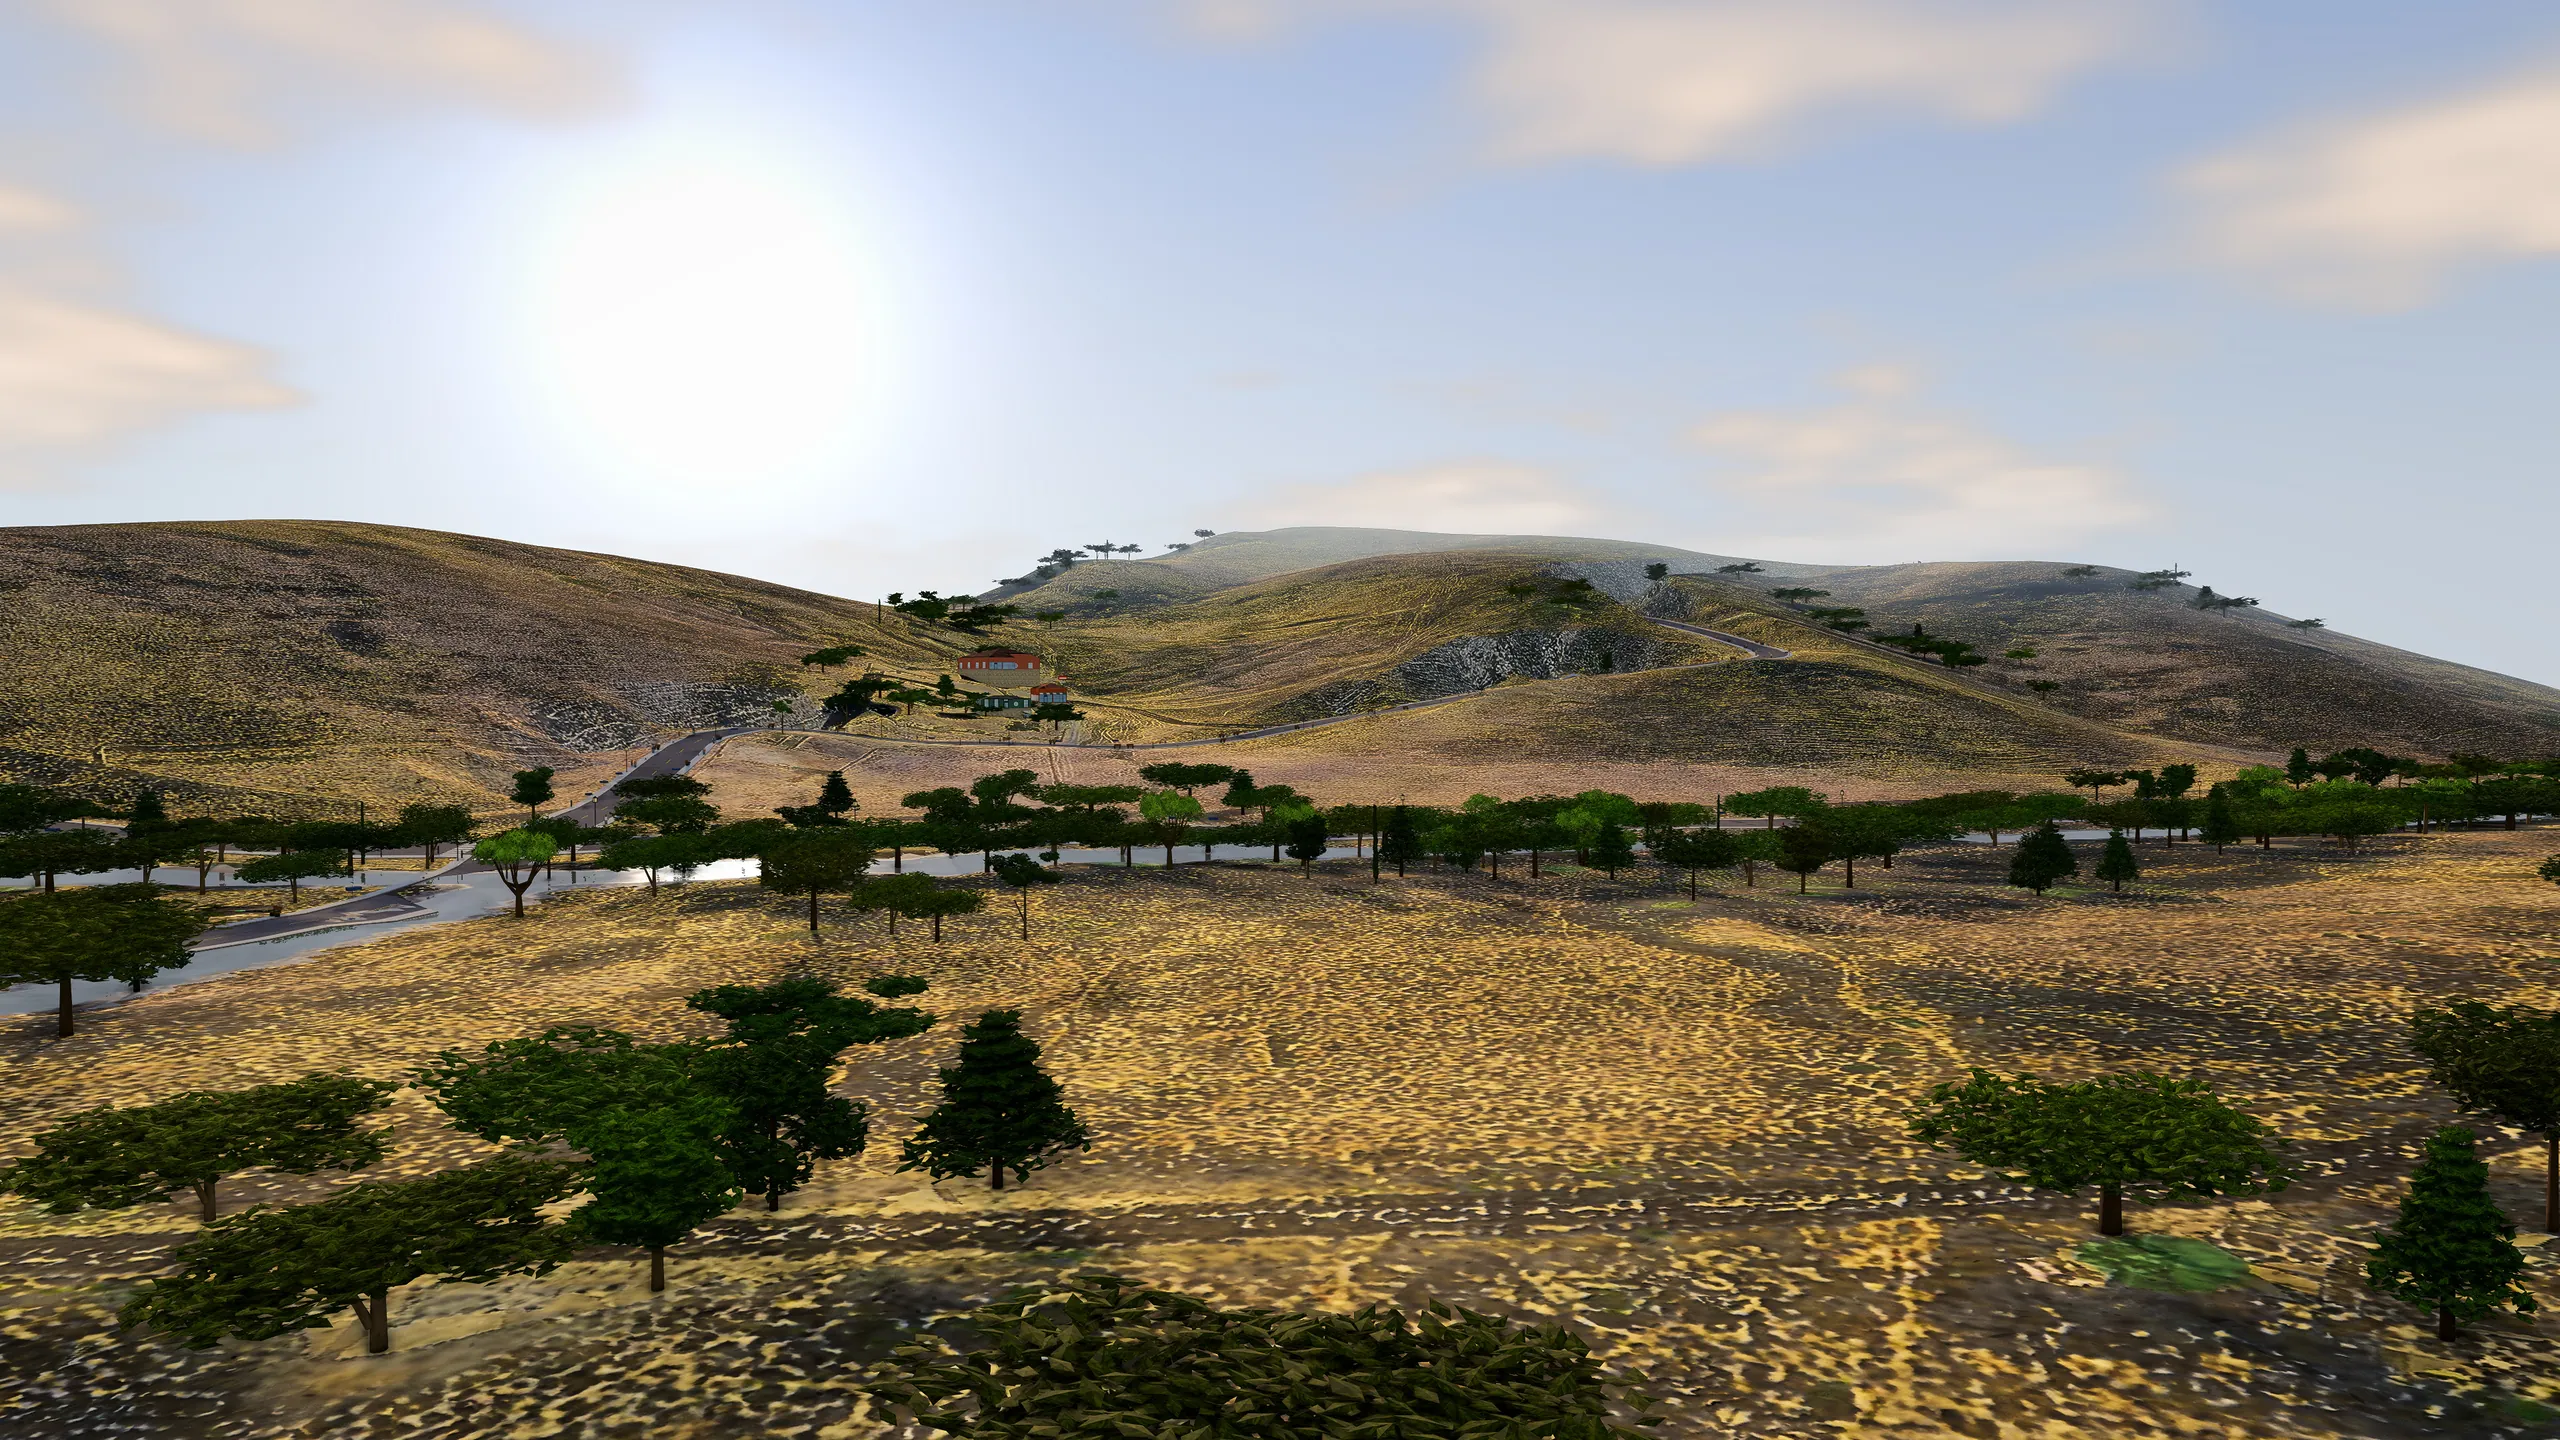
Harmony Valley, San Luis Obispo County, in GeoFrame: a low-angle view across the Perry Creek corridor into the late-afternoon sun.
Harmony ValleySan Luis Obispo CountyA low-angle view across the Perry Creek corridor into the late-afternoon sun.
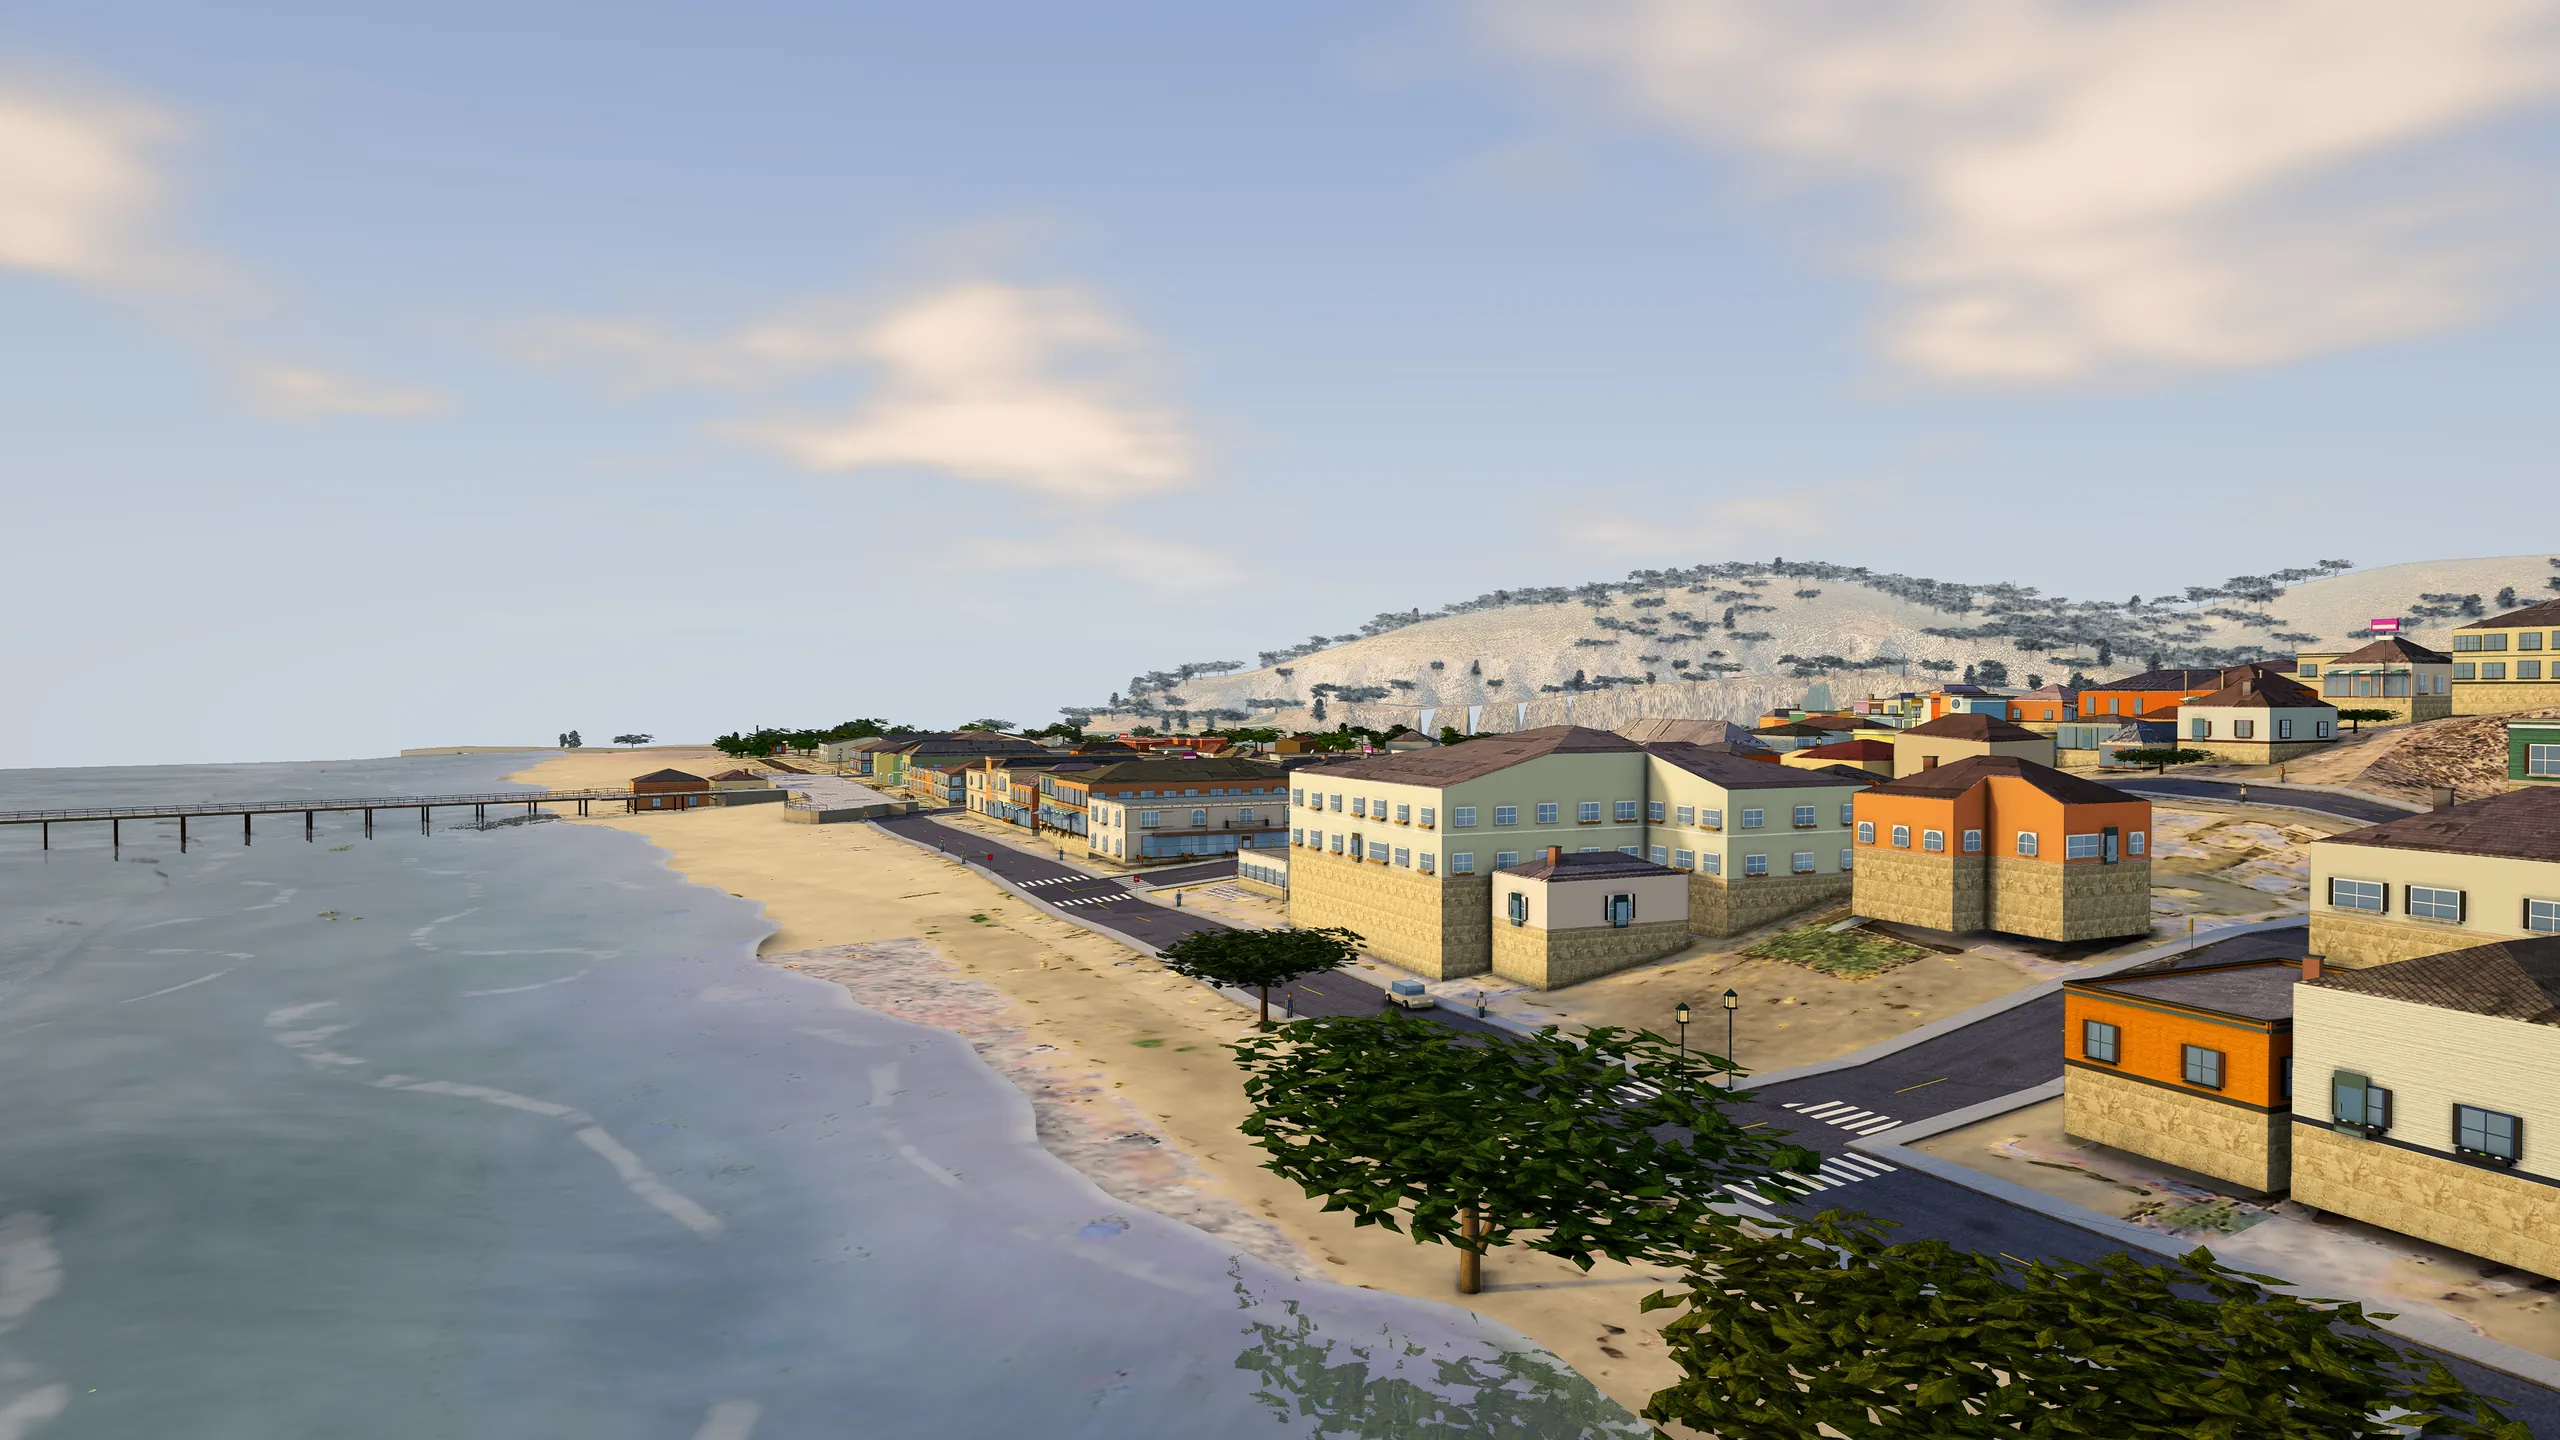
Avila Beach, San Luis Obispo County, in GeoFrame: eye level along the beachfront toward the pier, with real-time shadows and atmosphere.
Avila BeachSan Luis Obispo CountyEye level along the beachfront toward the pier, with real-time shadows and atmosphere.
Cambria, San Luis Obispo County, in GeoFrame: santa Rosa Creek mouth, Shamel Park and the West Village grid on the Cambria coast.
CambriaSan Luis Obispo CountySanta Rosa Creek mouth, Shamel Park and the West Village grid on the Cambria coast.
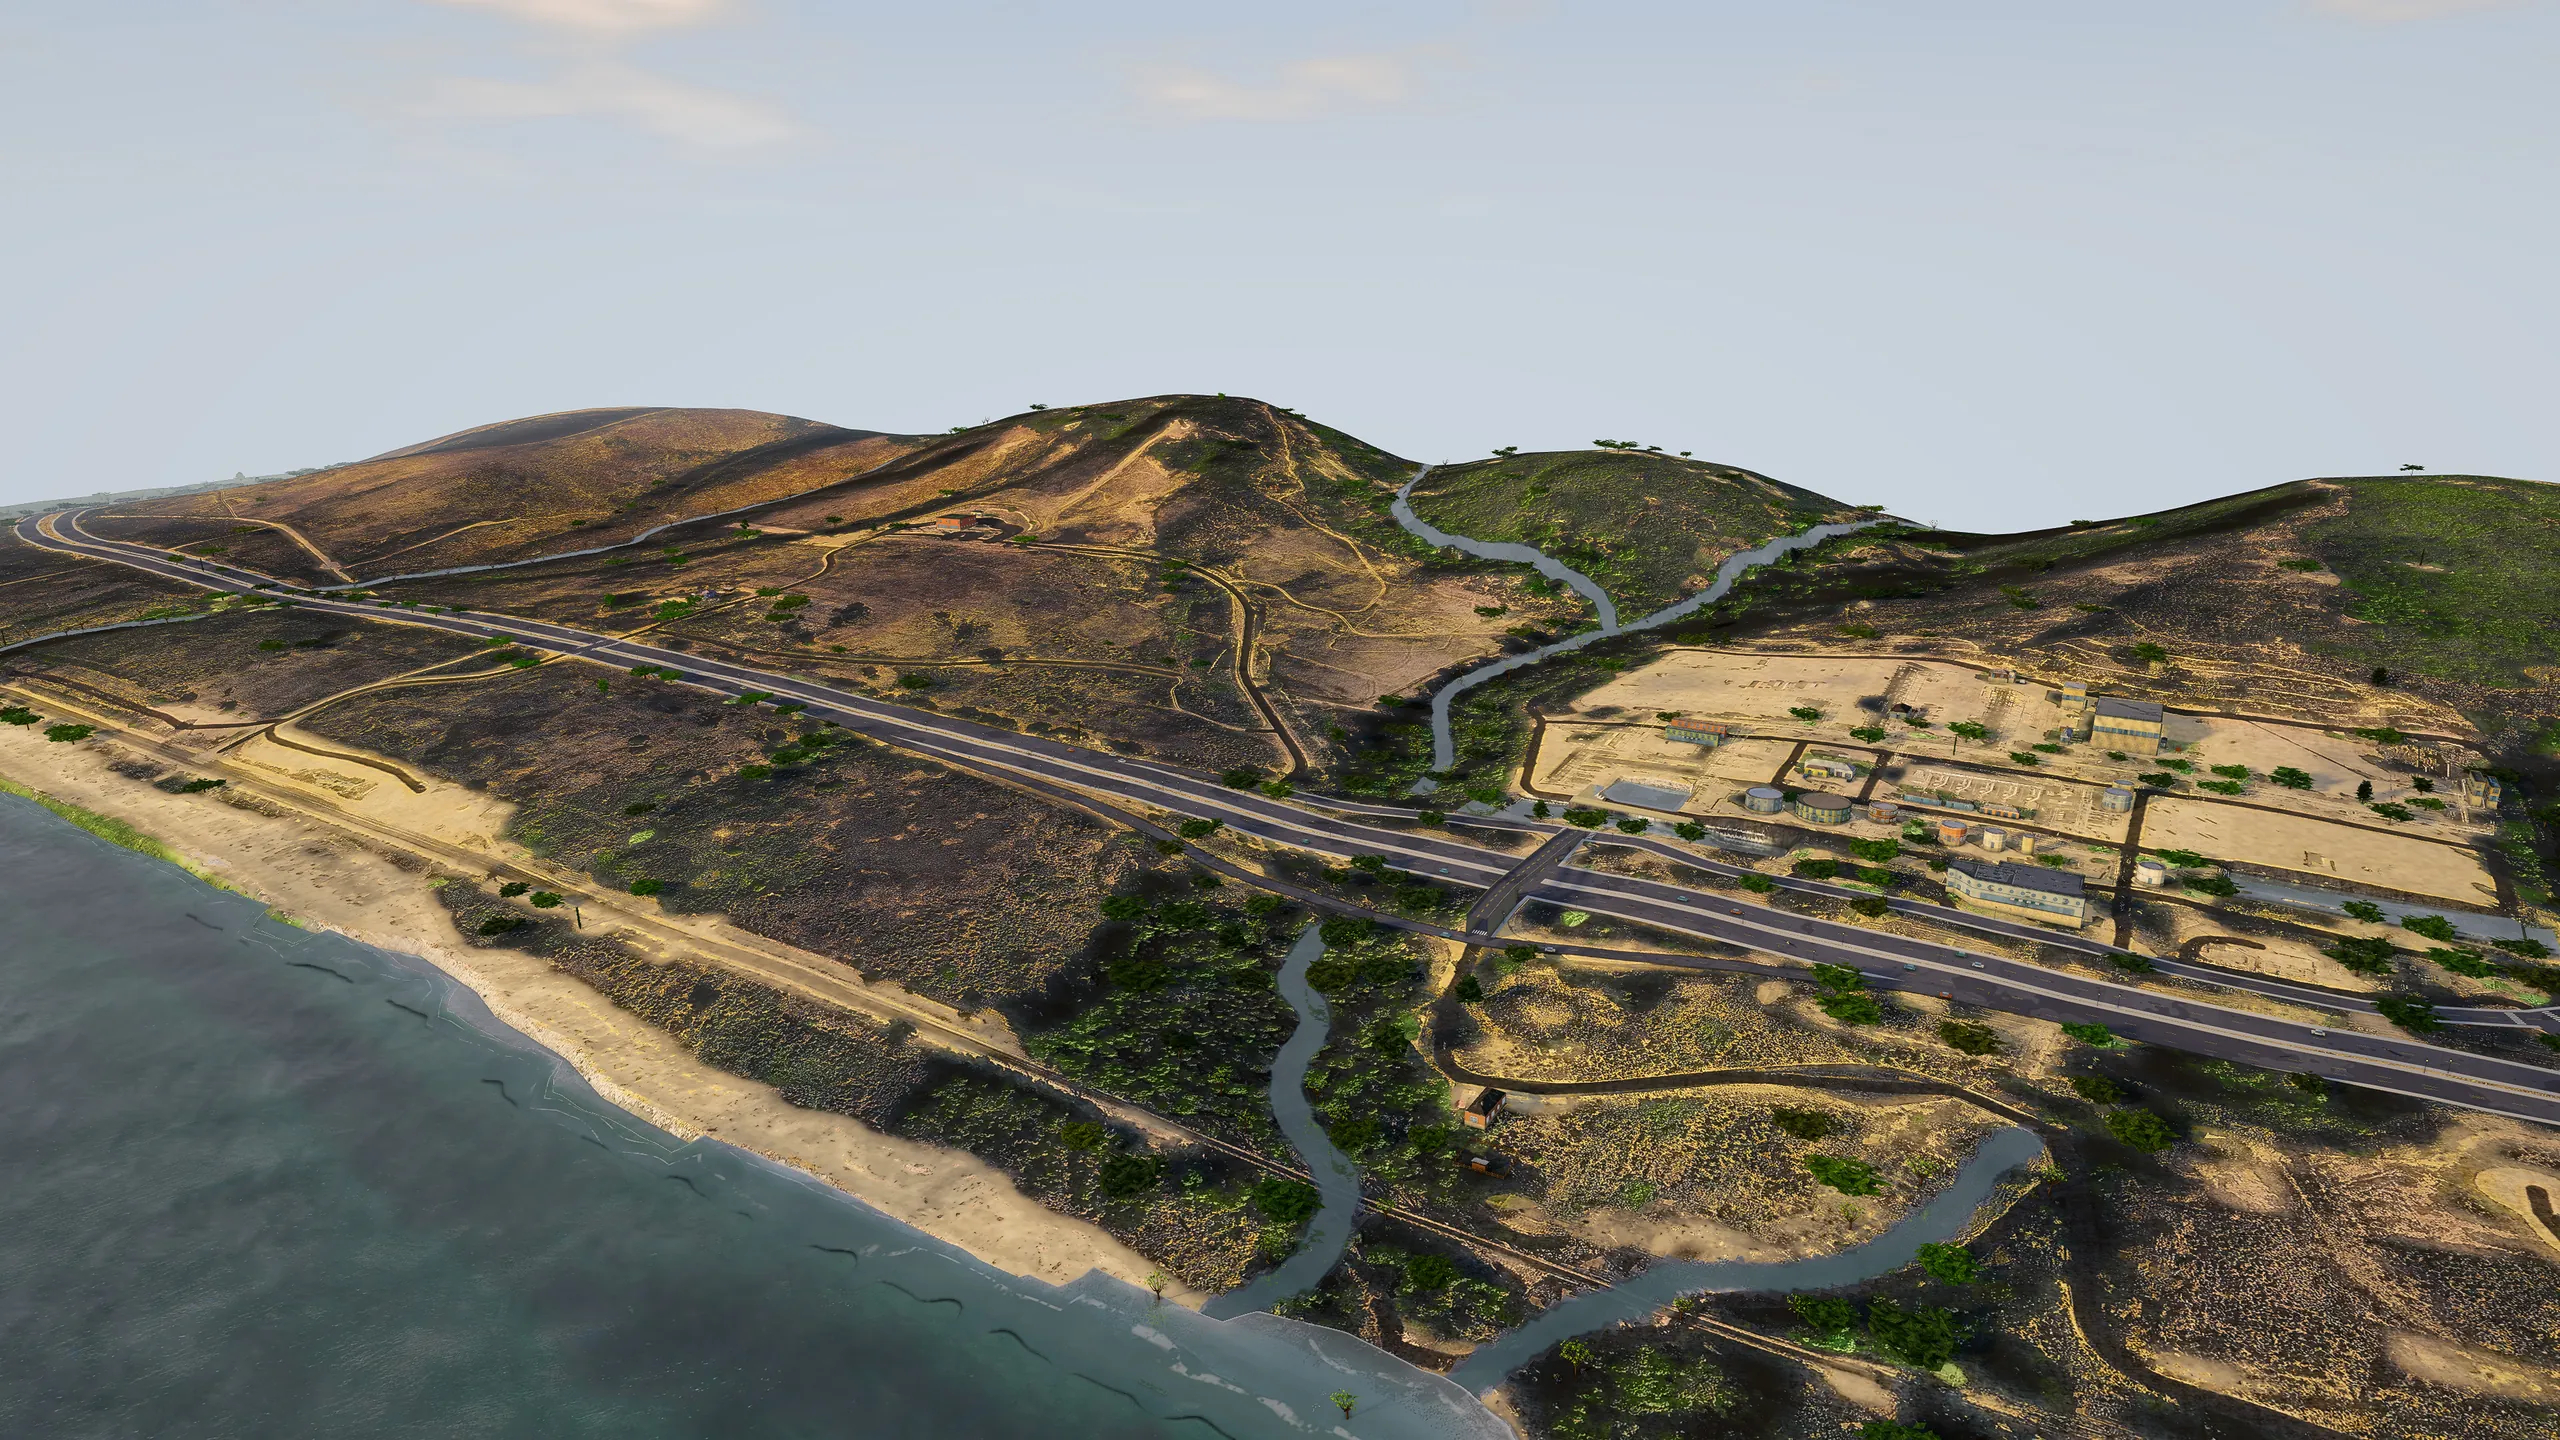
Gaviota Coast, Santa Barbara County, in GeoFrame: highway 101, the rail corridor, creeks and coastal hills in a single 3D model.
Gaviota CoastSanta Barbara CountyHighway 101, the rail corridor, creeks and coastal hills in a single 3D model.

Imagery © Esri, Maxar, Earthstar Geographics · Terrain and heights: USGS 3D Elevation Program · Map data © OpenStreetMap contributors · Building footprints © Microsoft (ODbL)

WHO IT'S FOR

Real context for the people
who decide what gets built.

01 / ARCHITECTS

Design against the real block

Context models are bought, traced or skipped, and the first neighbor complaint is about a view nobody checked.

Import your massing as DXF, IFC or OBJ, set it on the real lot and check height, sun and sight lines against the buildings that are actually there.

02 / DEVELOPERS

Test a site before you tie it up

Feasibility starts with a flat parcel map and a lot of imagination.

Draw the site, see terrain, neighbors and zoning in 3D, try three massing options in an afternoon and share a link with partners and lenders.

03 / CITIES & COUNTIES

Context for staff reports and hearings

Commissioners and residents read plan sets, then react to the building once it is framed.

Show the proposal in the neighborhood it will stand in, at the time of day people care about, from a clean presentation account on the projector.

04 / CRE BROKERS

Sell the location, not just the floor plate

Listings show a pin on a map and an aerial photo from straight above.

Walk a buyer around the property and its surroundings in 3D, with parcels, addresses and nearby uses a click away.

05 / UNIVERSITIES

Studios on streets students know

Planning and architecture studios rebuild the same site model every term.

Students model proposals in their own town, in a browser, with no workstation lab and free class accounts.

PROPERTY DATA

Know every parcel.
Who owns it, how big it is, how it's zoned.

Click any building and GeoFrame pulls up the property behind it: the owner of record from the county assessor, the parcel number, the lot size and the zoning, next to the building's own measurements.

GeoFrame property panel for a Cal Poly residence hall: owner State of California, APN 073-341-019, lot size 332 acres, six stories, 22.7 m tall
Estrella, Cal Poly: a State of California parcel, as the property panel shows it.
The same GeoFrame property panel on an iPhone
On the phone, too The same record on site, in front of the building.
Owner of record
The assessee as the county assessor lists it, with "in care of" and the owner's mailing address.
APN & legal description
The assessor's parcel number and the recorded legal description.
Lot size
Acres and square feet, from the county planning record or the parcel outline.
Zoning & land use
The city zoning district, the county land-use category, the coastal-zone flag and the community.
Building size
Footprint in m² and square feet, stories, and height measured from USGS LiDAR.
Address
The building's name and street address, from OpenStreetMap and the county's address points.
WHO USES IT

The first question, answered on the map

  • Brokers: who to call. The owner of record and their mailing address, on the building you are looking at.
  • Developers: lot size, zoning and the coastal zone before the first site visit.
  • Planners: APN, land use and zoning for the staff report, next to the 3D context.

From public county records: the County of San Luis Obispo assessor and planning services and each city's public zoning layer, looked up one parcel at a time and labeled with its source. Owner names are shown in San Luis Obispo County; elsewhere the panel shows the APN and lot size. Records can lag recent sales and changes, so verify with the county before relying on them. Presentation accounts hide owner names.

HOW IT WORKS

Three steps from a rectangle
to a model you can present.

  1. A finished GeoFrame district in Templeton seen as a whole 01

    Draw a district

    Drag a rectangle on the map, anywhere the public data reaches, from 500 m to 2 km a side. GeoFrame snaps it to the street grid and shows what it will contain before you build.

  2. The Cal Poly district as a complete 3D model with terrain, buildings and trees 02

    It builds from public data

    In the background, while you keep working: USGS LiDAR for terrain and building heights, OpenStreetMap footprints and streets, aerial imagery, tree canopy, water and shoreline, county parcels and a street-level photo survey for facades.

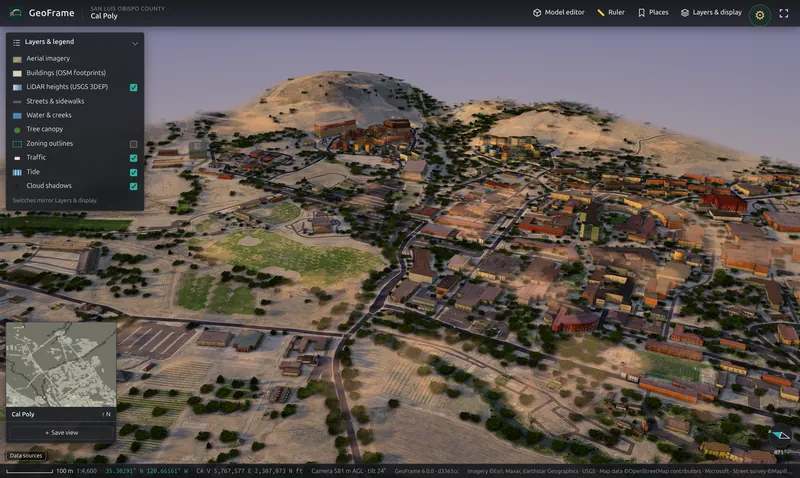
  3. GeoFrame in the browser with layers, minimap and saved views 03

    Study it, then share it

    Open it in the browser. Place massing, import CAD, set the sun, measure, save views and share a named map with your team, your client or the public meeting.

WHAT YOU CAN DO

Everything a site study needs,
in one browser tab.

GeoFrame is professional mapping software for the questions that come before drawings: how tall, how close, what it blocks, and what the neighbors will see.

SUN & SHADOW

Any hour of the day

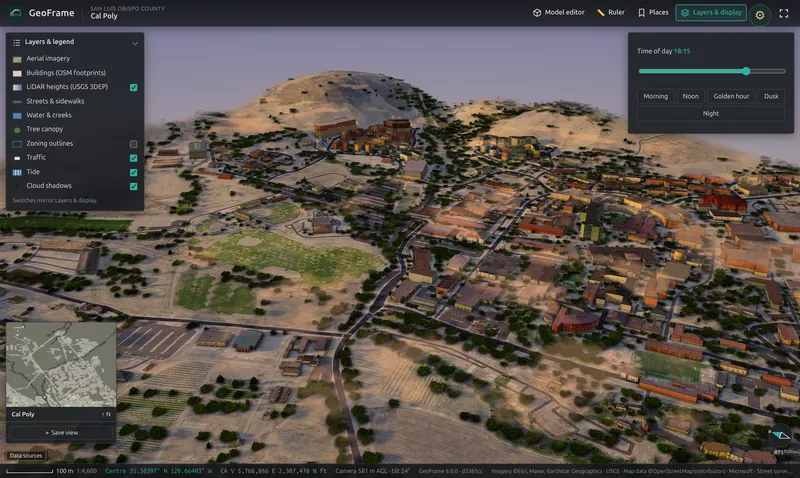
Scrub the time of day from morning to dusk and watch real shadows fall across real terrain. Presets for golden hour, dusk and night make context views for a hearing in seconds.

GeoFrame time-of-day control set to 18:15 over Cal Poly
CREATOR

Massing studies in place

Rough out a building in Simple mode with width, depth, floors and use, or open the full 3D editor with roofs, holes, grouping and snapping. Place it on the real lot and walk around it.

GeoFrame Creator placing a building on a lot
AI-ASSISTED

Describe it, then refine it

Type what you want, such as "three-storey mixed use, retail at grade", and Creator drafts a starting model you can edit shape by shape.

LAYERS

The planning context, switched on

LiDAR building heights, official zoning, parcels, streets, water, tree canopy and traffic: each one a switch, each with its source in the legend.

MEASURE

Ruler and coordinates

Two clicks measure ground distance in metres and feet. The status bar shows latitude, longitude and California State Plane coordinates.

ADDRESS SEARCH

Find any address

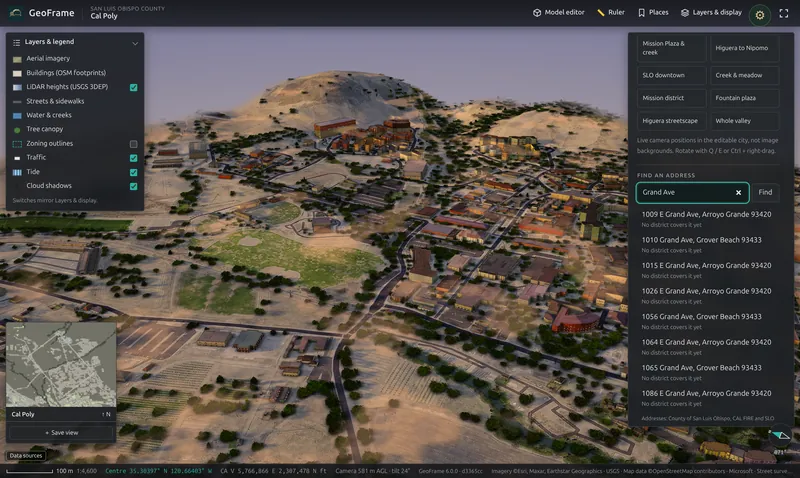
Search the county's address points and fly straight to the parcel. Press / anywhere to start typing.

GeoFrame address search results for Grand Ave
AND MORE

Built for teams, presentations and integration

  • Presentation accounts open straight into the right district at the right hour, with owner names hidden, ready for a projector.
  • Accounts and permissions: administrators decide, per user, who can create districts, edit and publish.
  • Saved views and bookmarks for the camera angles you show every time.
  • Python API to list districts, place objects and script studies from your own tools.
  • Exports: save a picture of any view, or a Creator model as .glb.

CAD IMPORT

Bring the model
you already have.

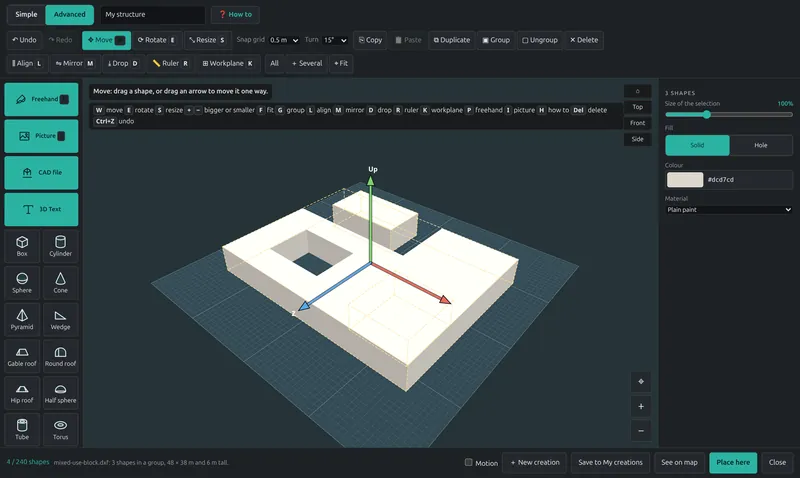
Drop a drawing or a model on the Creator. DXF footprints become extruded volumes with their courtyards; IFC comes in by building element, with walls, slabs, roofs, windows and openings cut; meshes keep their materials. Then place it on the real site, turn it, resize it and save it with the map.

  • DXF
  • DWG
  • IFC
  • OBJ
  • STL
  • glTF / GLB
  • PLY
  • DAE
  • 3DS
  • FBX

DWG is converted on the server when the converter is installed. Units and up-axis are read from the file.

A DXF drawing imported into the GeoFrame Creator as three extruded shapes
A three-layer DXF, imported: 48 × 38 m with a light court.
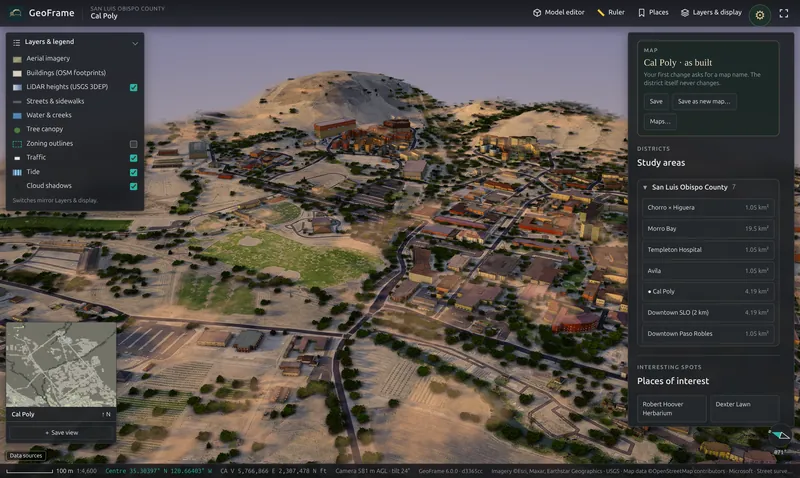
GeoFrame Views panel with the map bar and the list of study areas

CUSTOM MAPS & COLLABORATION

Try ideas freely.
The base map never changes.

Your first change to a district asks for a name and starts a map of your own. It saves as you work and the district as built stays untouched, so five options for one site are five maps, side by side.

  • Private by default, shared with your team in one switch
  • Teammates open a shared map and save their own copy to change it
  • The last five versions of every map are kept
  • Your own districts stay private until you publish them

ANY SCREEN

The office, the site visit
and the council chamber.

GeoFrame runs in the browser with nothing to install. Quality adapts to the device, from a workstation graphics card to an iPad or a phone in the field.

The Cal Poly campus in GeoFrame on a desktop browser
Desktop Chrome, Edge, Safari or Firefox, up to Extreme quality on a graphics card.
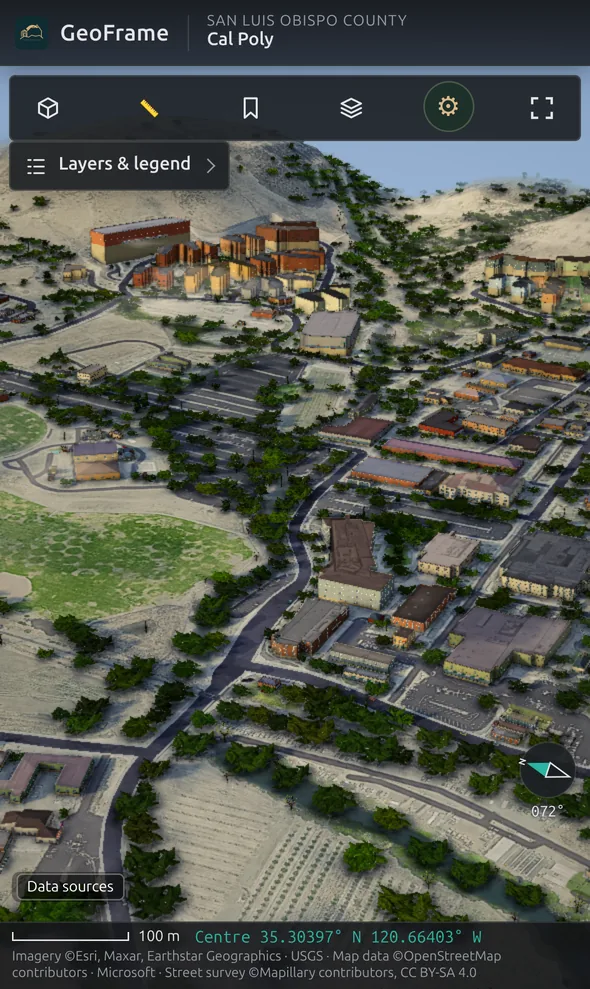
GeoFrame on an iPhone showing the Cal Poly district
iPad and phone Touch controls, the same districts and the same maps.

DATA & TRUST

Public sources, labeled.
Your data, where you want it.

Every district records where its data came from, and the app credits every source on screen.

Terrain & heights
USGS 3D Elevation Program (3DEP) LiDAR
Buildings & streets
OpenStreetMap footprints, roads, paths and water
Ground
Aerial imagery and tree canopy, restored for a natural look
Property
County parcels, address points and official zoning
Facades
Street-level photo survey (Mapillary contributors)
Honest about gaps
Unseen roofs, rear walls and missing heights are estimated, and the app says so. GeoFrame is a planning model, not a survey.
ON-PREMISES

Run it inside your network

For agencies, firms and campuses that keep data in-house: GeoFrame installs as a single Debian package on your own server, under a signed, seat-based license that never phones home.

  • No data leaves your network
  • District builds run on your hardware
  • Install and training included
Ask about on-premises →

QUESTIONS

Straight answers.

About data, accuracy, devices and deployment.

Where can I build a district?

Anywhere the public data covers. Terrain and heights come from the USGS 3D Elevation Program, which covers the United States; footprints and streets come from OpenStreetMap. Parcels, addresses and official zoning are loaded per county. San Luis Obispo County is fully set up today, and we add counties on request.

How accurate is it?

Building outlines and streets are where OpenStreetMap maps them, and terrain and building heights are measured by LiDAR. What the data can't see, such as a rear wall or a roof shape, is estimated and labeled. It is a credible planning model of a place, not a survey-grade twin.

Can I bring my own design?

Yes. Import DXF, DWG, IFC, OBJ, STL, glTF, PLY, Collada, 3DS or FBX into the Creator, or draft a building there from scratch, then place it on the real lot.

Who can see my changes?

Only you, until you share. Edits go into a named map of your own and the district as built never changes. Share a map with your team in one switch.

Does it run on an iPad or a phone?

Yes. GeoFrame runs in desktop browsers, on iPad and on phones, with touch controls and quality that adapts to the device. There is nothing to install.

Can we run it on our own server?

Yes. The on-premises license installs GeoFrame as one Debian package with a signed, seat-based certificate. No license check leaves your network, and district builds run on your hardware.

SEE YOUR SITE IN 3D

Send us an address. We'll show you the block around it in 3D.